How to Get Agent Observability Right
Agent observability is more than logs. Learn what traces record, how they support agent decisions, a worked example, and the limits of visibility into model reasoning.
An agent that works in a demo can fail quietly in production: it chose a wrong tool, looped over a step, or spent tokens without reaching a goal. When that happens, a single output line tells you almost nothing about why. The real problem is reconstructing the sequence of decisions and actions that led to a bad outcome, so the failure can be diagnosed and the next one prevented.
Direct answer: Agent observability means recording the structure of an agent run, not just its final answer. Anthropic's guidance on building effective agents stresses surfacing reasoning and tool use, and OpenTelemetry traces supply the model: a trace is a tree of spans that records each operation with timing, attributes, and status. Together they support diagnosing where an agent went wrong.
Making that sequence observable is what turns a black box into a system an engineer can reason about.
Delta: This article adds a decision framing beyond the sources: it maps trace structure to debugging and evaluation decisions, with claim status explicit.
The mechanism
The starting point from Anthropic's engineering guidance is that effective agents are built from simple, composable patterns and that their intermediate steps should be visible. A workflow chains steps in a fixed order, while an agent decides which steps to take next. In both cases the system produces a sequence of decisions, tool calls, and results. The practical consequence is that observability is designed in at construction time, by deciding what each step will record before the agent is deployed.
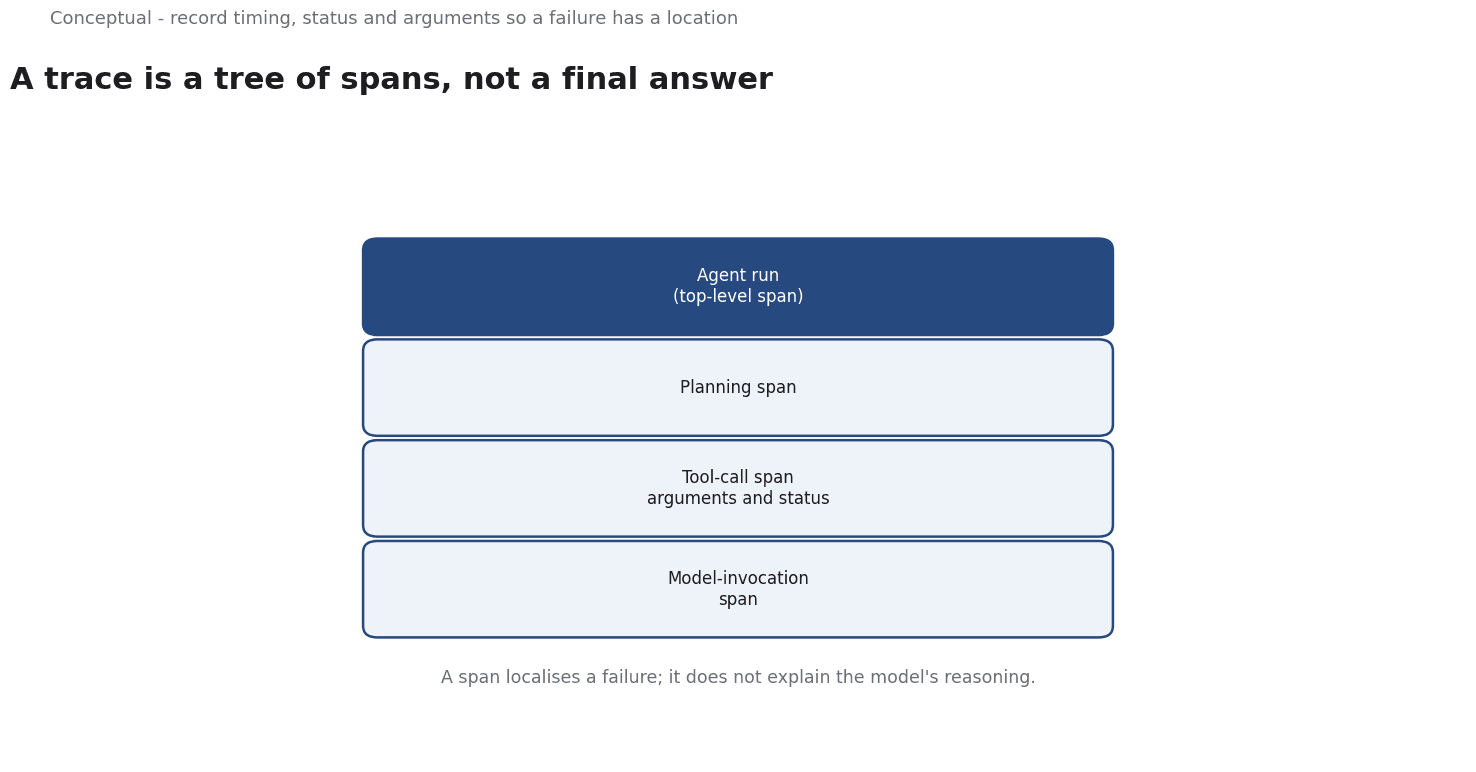
OpenTelemetry supplies a concrete structure for that record. A trace follows a single request or operation as it moves through a system, and it is composed of spans. Each span represents a unit of work with a name, a start and end time, attributes, events, and a status. Spans nest into a tree that shows parent-child relationships, so a top-level agent run can contain child spans for planning, for each tool call, and for each model invocation. Context propagation carries the trace identity across those boundaries, which is what keeps a distributed run coherent.
Mapped onto an agent, this structure answers specific questions. Which tool was called, with what arguments, and how long did it take? Did a step fail and get retried, and how many times? Where did the run spend its latency and its tokens? Because a span records timing and status, a slow or failing step is visible as a node in the tree rather than hidden inside a single output string. The consequence for debugging is that a failure becomes a location to inspect, not a guess about the model's intent. A clear location shortens the loop from symptom to cause.
The same record supports evaluation. Anthropic's guidance emphasizes testing agents thoroughly and starting with simple patterns before adding complexity. A trace provides the unit of evidence for that testing: a run can be compared against an expected sequence of steps, and a regression can be attributed to a particular span. The broader consequence is that observability and evaluation share a substrate. Without a structured record, evaluation degrades to checking only the final answer, which misses the wrong-but-plausible path that reached a correct-looking result.
A worked example
The following is hypothetical and illustrative. An agent that answers customer questions began returning slow, inconsistent results. Three checks were applied to its traces. First, the trace tree was inspected for the number of tool-call spans per run, which revealed repeated calls to the same lookup tool. Second, span timing was compared across runs, showing that one retrieval step dominated latency. Third, span status and attributes were checked, which surfaced a tool returning errors that the agent retried without changing its arguments. The outcome was a targeted fix: the lookup was given clearer arguments and a retry cap, and the slow retrieval was cached. Subsequent traces showed fewer spans and lower latency, confirming the change.
Evidence status
| Claim | Status | Source | Verified | Recheck when |
|---|---|---|---|---|
| Effective agents use simple composable patterns and surface intermediate steps | source-reported | Anthropic | 2026-11-18 | Agent design guidance is revised |
| A trace is a tree of spans with timing, attributes and status | source-reported | OpenTelemetry | 2026-11-18 | The trace specification changes |
| Structured traces support debugging and evaluation of agent runs | inferred | Derived from the sources | 2026-11-18 | Tooling or evaluation methods change |
The first two rows rest on the sources directly: the design guidance from Anthropic and the trace model from OpenTelemetry. The third row is an inference that combines them, since the sources do not state that tracing improves evaluation. Treat it as a testable expectation rather than a settled fact, and revisit each row when the underlying guidance or the trace specification changes.
What it cannot do
Observability cannot expose the model's internal reasoning. A span shows that a step ran, how long it took, and what it returned, but not why the model chose that step. Recording a stated rationale is a self-report, not a causal explanation, and it can be wrong or confabulated. The limit matters because the most interesting agent failures are decision failures: the model picked a plausible but wrong action. Trace data localizes those failures without explaining their cause, so the engineer still has to form and test a hypothesis about the decision itself.
The hidden cost is volume and noise. A thorough trace of every step, attribute, and tool result can be large, and storing it for every run is expensive. Sampling reduces that cost but also removes the rare failures that observability is meant to catch, which is the paradox at the center of the practice. There is also the cost of instrumentation itself: deciding where spans begin and end, propagating context through asynchronous calls, and maintaining that code as the agent changes. These are engineering costs that appear after the demo works, not before.
If spans are added around successful steps but not around retries, errors, or fallbacks, the trace looks clean while the agent is actually struggling. Another failure is logging too little context in attributes, so a span says a tool was called but not with which arguments, making reconstruction impossible after the fact. A third is treating a trace as a transcript of intent, when it is only a record of operations that happened to execute. Each of these produces a reassuring record that fails exactly when it is needed.
The boundary is that observability is diagnostic, not preventive. It tells you what happened after a failure, not how to stop the next one. Preventing bad agent behavior requires the design controls that Anthropic describes: clear tool definitions, narrow scope, and human review for consequential actions. Traces feed those controls by showing which boundaries were crossed, but they do not enforce them. Confusing visibility with control leaves a system that is well understood and still unsafe, which is a poor trade in any production setting that touches real users or money.
Finally, the instrumentation needs review as the agent evolves. New tools, new orchestration patterns, and new model versions change which spans matter and which attributes are worth keeping. A trace schema that was adequate for a single tool call may be useless for a multi-step orchestration with branching and parallel work. The discipline is to revisit what is recorded whenever the agent's structure changes, and to confirm that the spans still answer the questions that debugging and evaluation actually ask, rather than accumulating fields that no one reads.
The counterargument that full tracing is worth any cost is fair for low-volume, high-consequence agents and incomplete for high-volume ones.
It ignores storage expense and the risk that sampling removes the very failures the trace was meant to reveal.
A decision test
- Map the agent's steps and decide which of them become spans.
- Record timing, status, and the arguments that matter for each tool call.
- Include retries, errors, and fallbacks in the trace, not only successes.
- Establish context propagation across asynchronous and cross-service boundaries.
- Check that a failure can be localized to a span from the record alone.
- Choose a sampling policy that preserves rare failures within the budget.
- Review the trace schema whenever the tools or orchestration change.
The test treats a trace as evidence for a decision: can an engineer locate and diagnose a failure, and can an evaluation compare runs against an expectation? Steps that do not serve those questions add cost without insight, and should be dropped before they become permanent overhead.
For further reading, see AI Risk Assessment: A Pre-Deployment Checklist.
References & Further Reading
- Anthropic, 2026. Building effective AI agents — Guidance on agent design including checkpoints and human oversight.
- OpenTelemetry, 2026. Traces | OpenTelemetry — Primary documentation on distributed traces, spans and context propagation.