AI Supply Chain Forecasting Trade-Offs
A better forecast is not automatically a better decision. Read the trade-offs, a worked example, and why error metrics miss the cost of being wrong.
AI forecasting is often sold as a straightforward upgrade: replace the spreadsheet with a model and errors fall. The relevant question is what an error costs, because a forecast that is slightly worse on average but better at the tail can be more valuable, as the supply-chain metrics article treats service level and inventory as the real outcomes, as the demand-forecasting article explains for metric choice. A model that optimises the wrong metric can raise cost while looking more accurate.
Direct answer:
Judge an AI supply-chain forecast by the decisions it changes — stock, service level, and waste — not by a single error metric, with a baseline and a record of the trade-offs.
Anthropic's use-case guides cover analysis patterns, and FRED provides dated external series. The boundary: this is educational orientation, not a guarantee — demand depends on conditions the model did not see, which the time-series article warns about non-stationarity, as the scenario-analysis article requires conditional thinking, as the publication standard forbids guaranteed outcomes.
The trade-offs
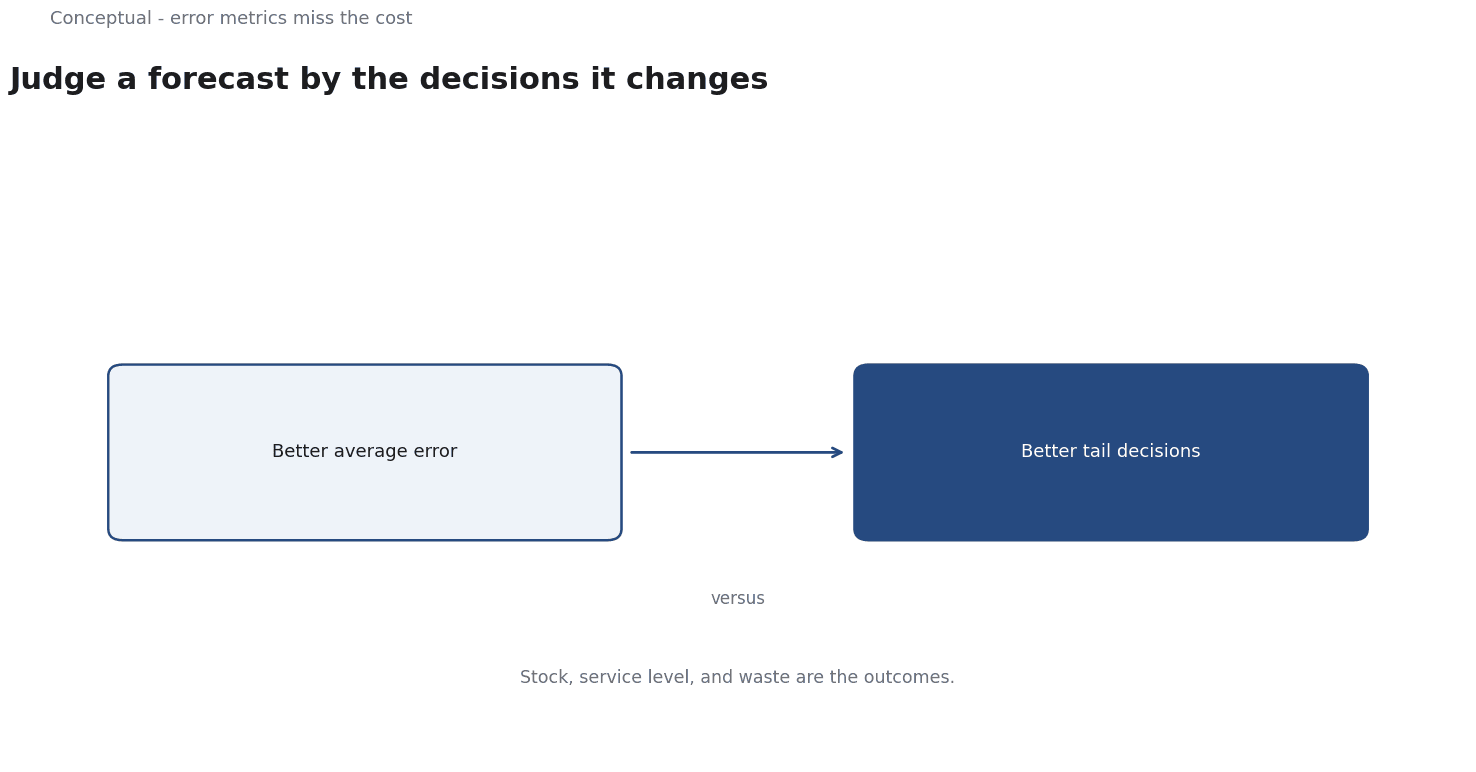
Accuracy versus decision value. A lower mean error can hide larger tail errors, which the demand-forecasting article treats as a metric choice, as the supply-chain metrics article argues for outcomes tied to service level, as the risk-assessment article requires residual risk to be stated.
Complexity versus explainability. A more complex model may be harder for planners to trust and override, which the model-explainability article treats as a trace question, as the human-in-the-loop article argues for meaningful review, as the analyst-workflow article advises on tools people actually use.
Freshness versus stability. Frequent retracking reacts to change but can chase noise, which the time-series article warns about non-stationarity, as the monitoring article treats retraining as a change trigger, as the model-collapse article warns about uncontrolled feedback.
Data versus provenance. External series help, but each input needs a source and a date, which the data-governance article requires, as FRED provides dated series, as the data-quality article warns about bad inputs.
Three consequences follow. The baseline should be a real forecast already in use, as the evaluation-rubric article requires for comparison, as the geo-experiment guidance recommends. The error metric should reflect the decision cost, as the demand-forecasting article advises. And the result should be reviewed when conditions change, as the monitoring article treats as a trigger.
A worked example
The following is hypothetical and illustrative. A retailer compares an AI forecast with its existing seasonal spreadsheet for a product line.
Three checks decide the comparison. First, what metric matters — mean error or the tail cases that cause stockouts, which the supply-chain metrics article treats as service level, as the demand-forecasting article advises for metric choice? Second, what is the decision cost of each error, as the scenario-analysis article requires, with a dated FRED series for any external input, as the data-governance article requires? Third, can planners explain and override the model, as the explainability and oversight articles advise, with a review after a material demand change, as the monitoring article recommends?
Three conclusions follow.
External data without a date is not reproducible, as the data-governance article requires. And the decision should be recorded with the trade-offs, as the decision-memo article requires.
What AI forecasting cannot do
It cannot see a shift with no signal in the data, which the time-series article treats as non-stationarity, as the scenario-analysis article requires conditional thinking, as the publication standard forbids guaranteed outcomes. It does not remove the need for planner judgement, which the human-in-the-loop article treats as meaningful review, as the explainability article advises for traces. And it cannot manufacture data quality, which the data-quality article treats as an upstream problem, as the data-governance article requires for provenance.
The counterargument that a model is simply more accurate is fair on many stable series and incomplete where the cost of tail errors dominates, which the worked example shows, as the demand-forecasting article argues for decision-relevant metrics.
A decision test
- Define the decision the forecast supports, as Supply Chains Metrics that Matter advises.
- Keep the existing forecast as a baseline, as the rubric article requires.
- Choose a metric that reflects error cost, as the demand-forecasting article advises.
- Date and source every external input, as the data-governance article requires.
- Check whether planners can explain and override, as the oversight article advises.
- Review after a material demand change, as the monitoring article recommends.
- Record the trade-offs, as the decision-memo article requires.
For the metrics, see Supply Chains: Metrics That Matter; for the method, see Time Series Forecasting.
References & Further Reading
- Anthropic, 2026. Guides to common use cases - Claude Platform Docs — Production use-case guides for ticket routing, customer support agents, content moderation, legal summarization and commerce agents.
- Federal Reserve Bank of St. Louis, 2026. FRED economic data — The primary time-series database used for macro indicators.