Drawdowns for Beginners
Drawdowns measure the depth of a fall, not its volatility. Learn the peak-to-trough method, a worked comparison, and where the measure stops being useful.
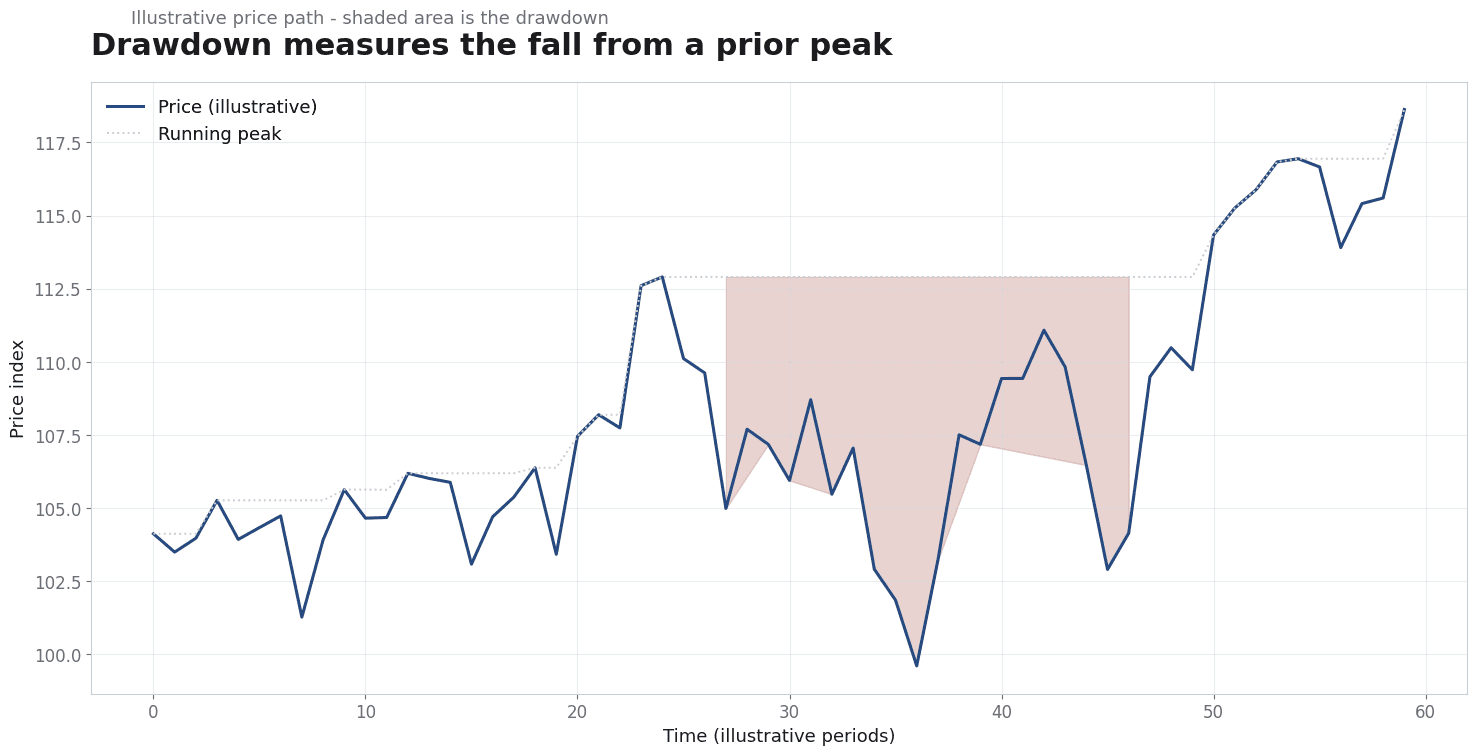
Beginners often treat volatility and drawdown as the same risk number. They are not. An investment can be only moderately volatile and still suffer a deep fall from its high point, while a volatile one can recover quickly. The problem is that an average return or a dispersion statistic hides the path, and the path is what determines whether an investor holds on or sells near the bottom.
Direct answer: A drawdown is the decline from a prior peak to a subsequent trough, measured as a percentage of the peak. The volatility source defines variation in returns over time, while the Damodaran source provides data and framing for risk, return and volatility. Use drawdown to describe the depth of a fall and volatility to describe how bumpy the ride was; they answer different questions.
Delta: This article adds a claim-status table and a peak-to-trough decision test beyond the sources: it maps each risk measure to an investor decision, with claim status explicit.
The mechanism
The volatility entry defines volatility as the degree of variation in a price or return series over time, commonly measured by the standard deviation of returns. It distinguishes realized volatility, computed from past observations, from implied volatility inferred from option prices. The practical consequence is that volatility is a symmetric statistical summary: it treats an upward jump and a downward jump of the same size alike. It describes how spread out returns are, not how far the price fell below a high point, and it says nothing about the order in which gains and losses arrived.
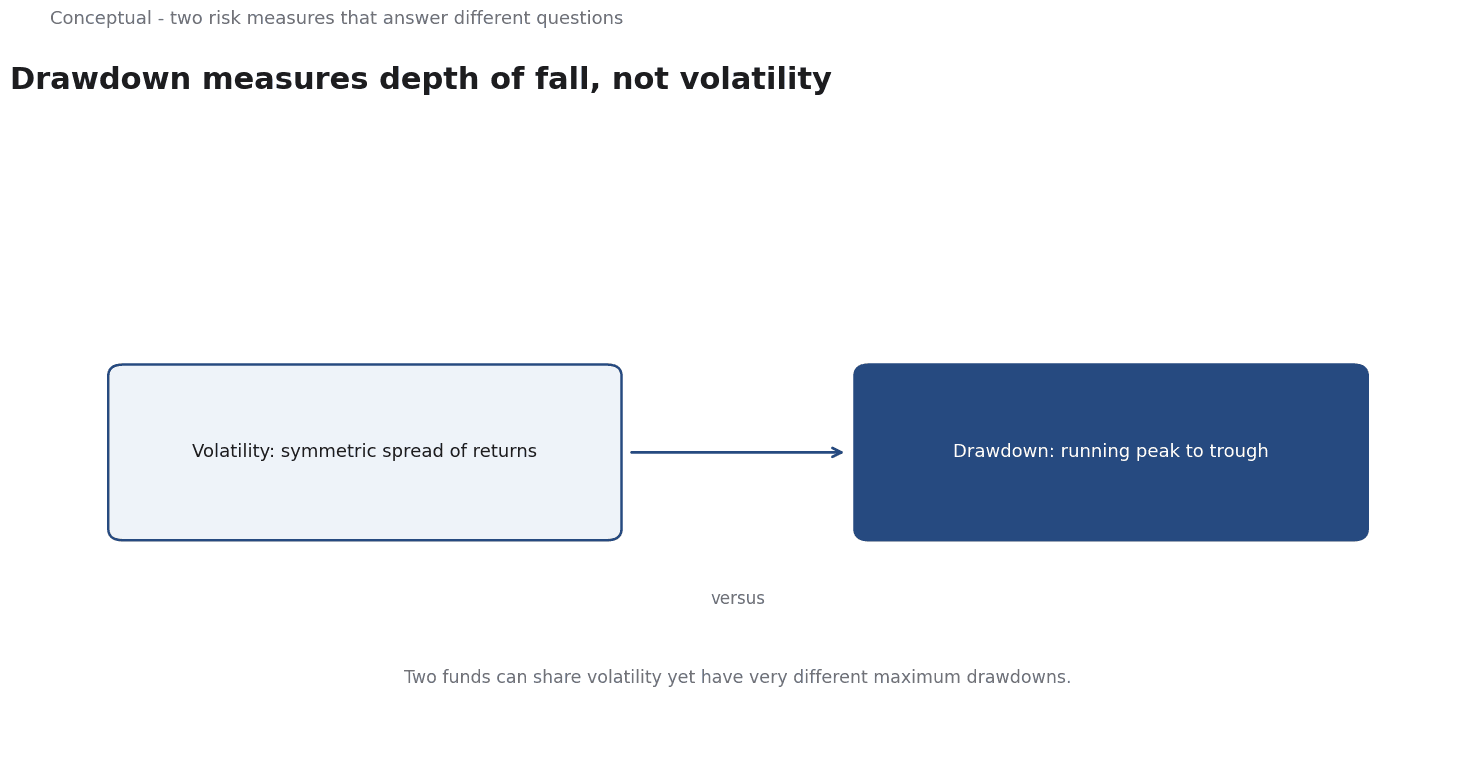
The Damodaran source supplies the broader frame of risk, return and volatility, with historical data and resources for estimating them. Its practical consequence is grounding: measured volatility is an input to a decision, not a verdict on what an investor will experience. Data on past returns can quantify dispersion, but the choice of window, frequency and total-return basis changes the number. A statistic that looks precise still depends on conventions the analyst selected.
Drawdown is the path-dependent counterpart to that distribution statistic.
It is measured from a running peak to the lowest point reached before a new peak is set, expressed as a share of the earlier peak. Because it depends on the sequence of returns, two investments with identical volatility can have very different maximum drawdowns. The one that strings losses together after a high point falls further, even if its average dispersion is the same.
The output of a sound evaluation is a pair of measures read together. Volatility answers how variable the returns have been; maximum drawdown and recovery time answer how deep the worst fall was and how long it took to regain the peak. Reading both lets a beginner separate a bumpy ride from a damaging one, and connects the number to the question that matters: could the investor have stayed invested through it?
A worked example
The following is hypothetical and illustrative. Two funds show similar annual volatility, so a beginner assumes equal risk. Three checks decide the comparison. First, peak-to-trough depth: one fund's worst fall is fifteen percent, the other's is forty percent. Second, recovery time: the shallow fund regains its prior peak in a few months while the deep one takes years. Third, sequence: the deep fund's losses arrive late, after contributions have grown. The investor in the deep fund redeems near the bottom and locks in the loss, while the other stays invested. The numbers are hypothetical; the peak-to-trough method is the contribution.
Evidence status
| Claim | Status | Source | Verified | Recheck when |
|---|---|---|---|---|
| Volatility measures the dispersion of returns over time, often by standard deviation | source-reported | Wikipedia, Volatility (finance) | 2026-11-18 | Definition revised |
| Damodaran Online provides data and framing for risk, return and volatility | source-reported | Damodaran, Damodaran Online | 2026-11-18 | Data updated |
| Drawdown is path dependent and not equivalent to volatility | inferred | Derived from the sources | 2026-11-18 | Measurement convention changes |
The first two rows restate the sources directly. The third is an inference: the volatility entry defines a distribution statistic, and neither source defines drawdown, so the distinction follows from measuring a peak-to-trough path rather than dispersion. Recheck the source claims when the definition or data changes, and the inferred claim whenever the measurement convention or window changes.
What it cannot do
A drawdown describes a path that has already happened; it does not predict the next fall. A historical maximum is the worst decline observed in a chosen sample, not a ceiling on future losses. A fund that never dropped more than ten percent in its recorded history can drop twenty percent next year.
The hidden cost lies in measurement choices. Computing a drawdown requires a price or total-return series, a defined running peak and a consistent window. Use price returns instead of total returns and dividends vanish from the recovery; shorten the lookback and an old, severe fall disappears. High-frequency data reveals deeper intraday troughs than daily closes. Each choice moves the number, so a drawdown quoted without its data source, frequency and window is not comparable to another. The discipline of recording those choices is the real work.
The main failure mode is ignoring recovery asymmetry. Losses and gains are not symmetric: a fifty percent decline needs a hundred percent gain just to break even. A beginner who focuses only on how far a fund fell, without asking how long recovery took, will misjudge the damage. Deep drawdowns are dangerous less because of the percentage itself than because of the time and the compounding required to undo it, and because the investor may abandon the position before that recovery arrives.
There is a boundary around what the measure explains. A drawdown says nothing about why a fall happened or whether the investment is sound. A deep decline can be a market-wide correction that recovers, or the first sign of permanent impairment; the number cannot tell them apart. It is also silent on the cause of the fall and on whether the investor's time horizon fits the recovery. For that reason it should be read with volatility and with an understanding of the underlying holding, not used as a standalone verdict.
Because the number depends on conventions, it needs review when those conventions change. A drawdown computed over five years differs from one over twenty, and a change in data provider can shift the recorded trough. Each figure should carry its window, source and recheck condition. Without that record, a future reader cannot tell whether a decline reflects the investment's behavior or a change in how it was measured.
The counterargument that volatility is fair for comparing assets is incomplete when the investor's real risk is abandoning the position at the bottom.
A decision test
- State what decision the risk number must support, such as whether you can hold through a fall.
- Define the measurement window and whether returns are price or total returns.
- Identify the running peak and the trough that follows it in the series.
- Compute the maximum drawdown as the largest peak-to-trough decline.
- Compute the recovery time back to the prior peak.
- Compare the result with volatility to separate a bumpy ride from a deep fall.
- Record the window, data source and a recheck condition for the figure.
The drawdown is useful only when its window and data basis are visible and it is read alongside volatility. The test turns a single scary percentage into a sequence of checks, so a beginner can see how deep the worst fall was, how long recovery took, and whether the number even applies to the decision at hand. For further reading, see Cash Flow Forecasting: A 13-Week Operating Model.
References & Further Reading
- Wikipedia contributors, 2026. Volatility (finance) - Wikipedia — The degree of variation in prices over time.
- Aswath Damodaran, 2026. Damodaran Online: Home Page for Aswath Damodaran — Publicly maintained datasets for industry averages, WACC, and valuation.