How to Get INP Optimization Right
INP measures the delay from a user interaction to the next paint. Learn what web.dev defines, a field-data example, and why a lab score cannot prove responsiveness.
INP is reported as a single responsiveness score, yet users experience delays one interaction at a time. web.dev documents what the metric measures and how Web Vitals frames thresholds. The real problem is moving from an aggregate number to a specific interaction that a team can actually fix.
Direct answer:
INP measures the time from a user interaction to the next rendered frame, summarized across interactions on a page.
web.dev defines it as a responsiveness metric and Web Vitals sets how thresholds are reported. The number describes experienced latency, not the cause of a slow interaction.
Delta: This article adds a claim-status table and a field-to-fix mapping beyond the sources: it maps an INP observation to a diagnostic decision, with claim status explicit.
The mechanism
web.dev defines Interaction to Next Paint, or INP, as a metric that assesses a page's responsiveness to user interactions. Rather than sampling a single event, it observes the latency of interactions across a visit and reports a representative value. The interactions considered include clicks, taps, and keyboard input, and the measurement runs from the input event until the next frame is painted. This makes INP a user-facing measure: it reflects what a person waits for after acting, not how busy a server was.
Web Vitals is a Google initiative that consolidates guidance on page quality, and it groups the core metrics that web.dev recommends tracking. Under this framing, INP is reported at a percentile of the observed distribution, which means a small share of slow interactions still affects the score. A practical consequence is that optimizing the average interaction is not enough. A page can feel responsive in most cases and still receive a poor INP because a few interactions are slow. Teams therefore need the distribution, not just the headline number.
The metric also separates cause from symptom. web.dev documents what is measured, but a high INP is a signal that something happened during input handling, rendering, or script execution. The same score can arise from long JavaScript tasks, from expensive style and layout work, or from a slow paint. Because the sources describe the measurement rather than the remedy, choosing a fix is an inference. The mechanism is a chain: an interaction is delayed, the delay is aggregated into INP, and a team must then locate the specific work that caused it.
That chain has a practical implication for tooling. Field data captures the interactions real users perform, while lab tools replay a fixed script and cannot reproduce every delay. web.dev distinguishes the observed experience from controlled measurement, so a number from one source is not interchangeable with the other. A team that treats a lab score as a substitute for field INP will miss the slow interactions that only appear under real conditions. The useful question is which interactions are slow, not whether a single test passed.
A worked example
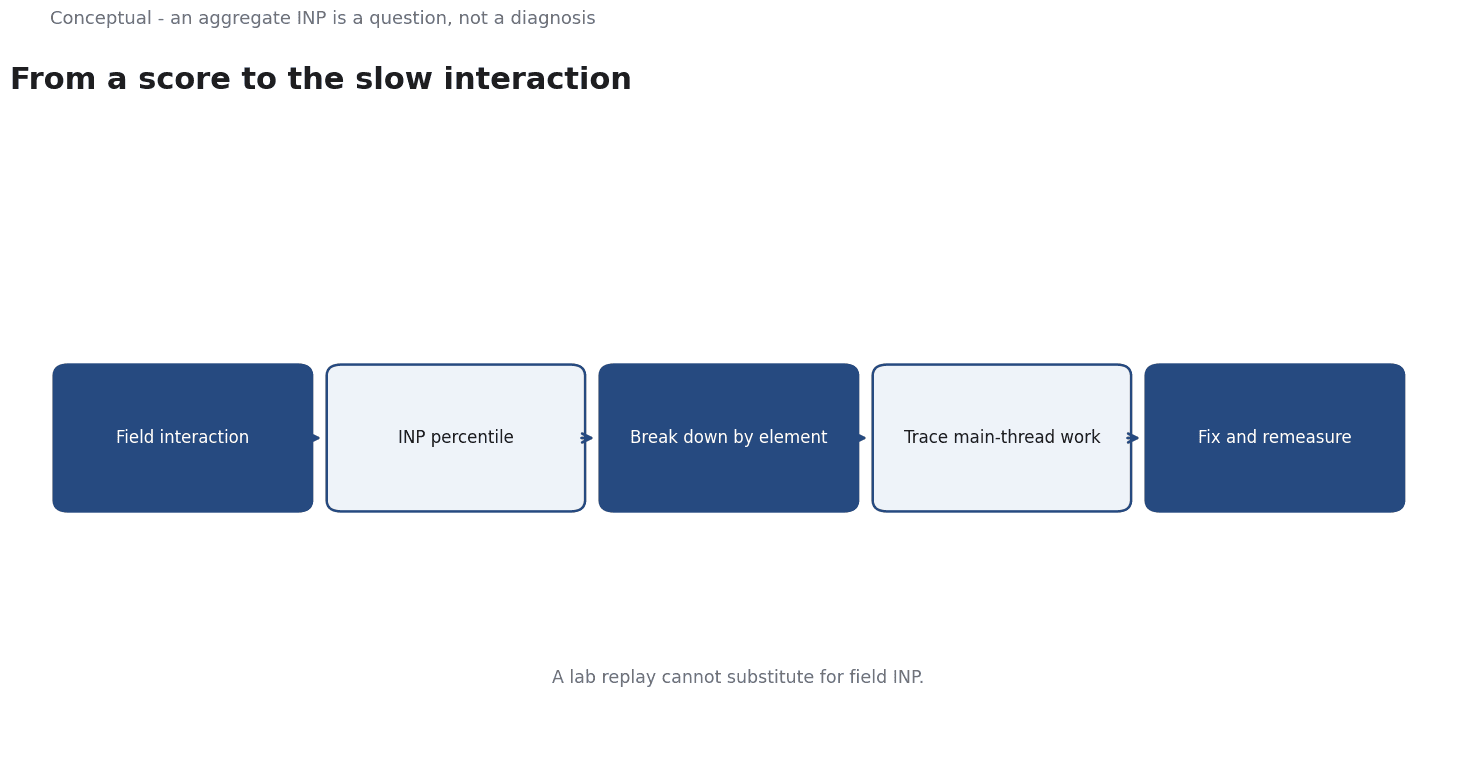
The following is hypothetical and illustrative. A team sees a page with a high field INP and assumes a third-party script is to blame. Three checks guide the investigation. First, the team confirms the score comes from field interactions rather than a lab replay, so the delays are ones users actually experienced. Second, it breaks the distribution down by interaction type and element, looking for whether taps on one control account for the slow tail. Third, it traces the worst interactions to main-thread work, distinguishing script execution from rendering. The checks show that a single filter control triggers a long task, not the third-party script. The team optimizes that handler and remeasures. The numbers are hypothetical; the diagnostic method is the contribution.
Evidence status
| Claim | Status | Source | Verified | Recheck when |
|---|---|---|---|---|
| INP assesses responsiveness from interaction to next paint | source-reported | web.dev, INP | 2026-11-18 | Metric definition revised |
| Web Vitals reports core metrics including INP at a percentile | source-reported | web.dev, Web Vitals | 2026-11-18 | Thresholds or reporting changed |
| Map a high INP to a specific interaction and fix | inferred | Derived from the sources | 2026-11-18 | Diagnostic tooling or app changes |
The first two rows restate definitions published by web.dev and can be verified against the source pages. The third row is an inference, because the sources define the metric but do not prescribe a diagnostic sequence. Recheck the source rows if the metric definition or reporting thresholds change, and recheck the inferred row when the application or the available diagnostic tools change.
What it cannot do
INP cannot identify what caused a slow interaction. It reports that a delay occurred and how large it was, but the sources describe the metric rather than the mechanism behind any given score. A high value is compatible with long JavaScript tasks, with layout and style recalculation, or with a paint that waited on the main thread. The metric narrows the search to interactions without naming the culprit. A team that treats INP as a diagnosis will waste time applying fixes that do not address the actual source of the delay.
The hidden cost is the effort spent chasing the wrong signal. Field data is noisy, and a single poor score can reflect a small number of users on slow devices or a specific interaction pattern. Optimizing against that noise can lead to changes that help the measured tail but do little for typical users. There is also a cost to chasing the metric itself: shortening work to improve a number can degrade functionality or accessibility if the interaction is made to respond before it is complete. The sources do not discuss these trade-offs, so they remain inferences.
A lab test runs a fixed sequence under controlled conditions and will not reproduce the interactions that real users perform. web.dev separates these measurement contexts, but teams often cite a passing lab score as evidence that responsiveness is solved. When field INP stays high, the lab result becomes a misleading comfort. A related failure is reporting only the aggregate, which hides the specific element or interaction that produces the slow tail. The number can look acceptable while one control remains painful to use.
There is a boundary around what web performance data covers. INP describes interactions on pages that are instrumented and observed; it says nothing about why a user hesitated, what they intended, or whether the page achieved a business outcome. A fast interaction on a confusing flow is still a poor experience, and the metric will not reveal that. It also cannot rank improvements by value, since it treats all interactions alike. Deciding which delays are worth fixing requires judgment that the metric does not supply.
Because both the application and the metric's reporting evolve, responsiveness work needs periodic review. Field data should be rechecked after releases, since new code can introduce long tasks that were not present before. Thresholds and definition details should be verified against web.dev when the sources change. A record of which interactions were fixed, and how the field distribution moved, makes the work auditable. Without that record, a team can regress to a slow state and only notice when users complain.
The counterargument that a single score is fair for tracking progress over time is reasonable for trend detection and incomplete for diagnosis, since an aggregate cannot show which interaction needs fixing.
A decision test
- Confirm the INP value comes from field data, not a lab replay.
- Break the distribution down by interaction type and element.
- Identify which interactions produce the slow tail.
- Trace those interactions to main-thread work or rendering.
- Form a hypothesis about the specific cause, not the metric.
- Apply the smallest change that addresses that cause.
- Remeasure field INP and record the interaction and outcome.
INP is most useful as a starting question rather than a verdict. The test moves from an aggregate score to a named interaction and a recorded fix, so responsiveness work can be checked rather than asserted. For further reading, see Data Quality in Practice.
References & Further Reading
- web.dev, 2026. Interaction to Next Paint (INP) - web.dev — Core Web Vitals metric for interaction responsiveness.
- web.dev, 2026. Web Vitals — The Core Web Vitals thresholds and what each metric measures.