INP Optimization: Common Questions
INP scores responsiveness across a visit, not one paint. See the mechanism, a worked diagnosis, a claim-status table, and why fix cost is local.
Teams often treat Interaction to Next Paint as just another score to raise, then discover the number barely moves. The web.dev material defines what the metric observes, but the cost of changing it lives in the event handlers and scripts that block the main thread. The real problem is not the score; it is attributing a slow response to the right phase of an interaction.
Direct answer:
INP assesses a page's overall responsiveness by looking at the latency of user interactions across a visit, not a single paint.
To improve it, find the slow interaction, identify which phase - input delay, processing, or presentation - consumes the time, then weigh each fix against its engineering cost. The definition is documented; the choice of fix is local judgment.
Delta: This article adds a claim-status table and a worked diagnosis beyond the sources: it maps interaction phases to a fix decision, with claim status explicit.
The mechanism
The Interaction to Next Paint definition describes a metric that assesses responsiveness by observing click, tap, and keyboard interactions over the life of a visit, then reporting a high percentile of those latencies rather than the first one. That design matters: a page can paint quickly and still feel sluggish when a user actually tries to use it. The metric rewards consistency across the whole session, so optimizing a single happy-path load tells you little about the experience it is meant to capture. For teams used to load-time metrics, this is a shift in what counts as success - from when content appears to when the interface answers.
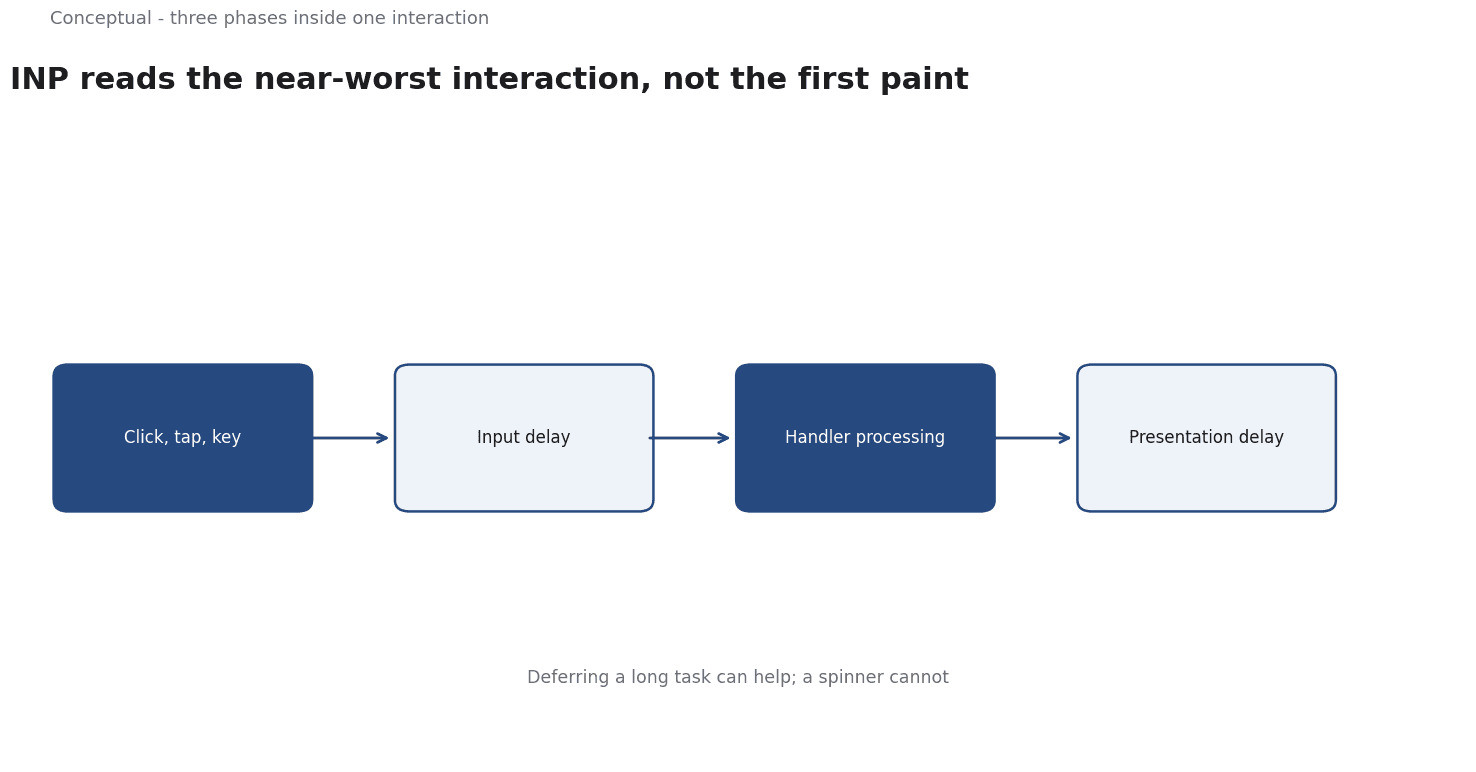
An interaction has three phases: the delay before the event handler runs, the processing time spent in handlers and the tasks they trigger, and the presentation delay before the next frame is painted. Most expensive INP cases come from long tasks on the main thread, where JavaScript - often from third-party scripts or one large handler - occupies the time the browser needs to render. The practical consequence is that the fix depends on which phase dominates. Adding a loading spinner does not shorten processing time; deferring a script might. Without a trace that separates the phases, teams tend to apply a generic fix and hope the score responds.
The Web Vitals guidance places INP among the Core Web Vitals with defined thresholds and recommends evaluating at a high percentile of real page loads. Thresholds turn the metric into a pass-or-fail signal, but they also invite overfitting: a result just under the boundary is not proof of a responsive interface, and a result just over it does not identify the cause. The sources define the signal; they do not prescribe a fix for a given site.
The cost of improvement is therefore concentrated in diagnosis and trade-offs. Splitting a long handler may be cheap; replacing a third-party tag may be neither cheap nor under the team's control. Because the metric reflects real interactions on real devices, a fix verified only on a developer machine can fail for the users who generated the poor score. The defensible workflow is to measure in the field where possible, trace a representative slow interaction, fix the dominant phase, and re-measure under the same conditions.
A worked example
The following is hypothetical and illustrative. A product page shows a poor INP score, and users report that opening the image gallery feels stuck. The team runs three checks. First, a phase check: a field trace shows the tap's delay is short but handler processing is long, pointing to JavaScript rather than rendering. Second, an ownership check: the long task belongs to a gallery script supplied by a vendor, not to first-party code. Third, a device check: the same tap is fast on a desktop and slow on a mid-range phone, confirming the script is the constraint for affected users. The outcome is a decision to defer the vendor script until after the first paint and to request a lighter build, with the original trace saved as the baseline. The scenario is hypothetical; the mapping from trace to fix is the contribution.
Evidence status
| Claim | Status | Source | Verified | Recheck when |
|---|---|---|---|---|
| INP assesses responsiveness from interactions across a visit | source-reported | web.dev: INP | 2026-11-18 | Metric definition changes |
| INP is a Core Web Vitals metric with defined thresholds | source-reported | web.dev: Web Vitals | 2026-11-18 | Thresholds or percentiles change |
| Fix choice depends on which interaction phase consumes time | inferred | Derived from the sources | 2026-11-18 | Tracing methods change |
The source-reported rows describe what the metric measures and where it sits among Web Vitals; neither names a fix. The inferred row is this article's synthesis of the three interaction phases into a diagnostic rule, not a documented recommendation. Recheck it if browser tracing tools change what can be observed or if the metric's computation shifts.
What it cannot do
This framing has a clear limit. The sources define INP and its thresholds; they do not tell you which interaction on your page is slow, which phase to fix, or what a given fix will cost. Those facts are local to a site and its users. A claim that a particular change will improve INP is a prediction about that site, not a conclusion the sources deliver. Treat the framework as a way to structure a diagnosis, not as a catalogue of remedies that can be applied without measurement.
A hidden cost is that the score compresses many interactions into one number. A single severe stall can dominate the result while other slow paths go unexamined, so a team can fix the reported interaction and still leave users facing a different one. Because the metric reports a high percentile rather than an average, improvement in the median may not move it at all. Recording the distribution of interaction latencies, not just the headline value, is part of the work, and that data collection has its own instrumentation cost and noise.
Synthetic clicks can miss the long tasks that occur during genuine use - scrolling, typing into a search box, or switching tabs while scripts run - and fast test hardware hides the execution cost that affects mid-range devices. A second failure is treating every long task as first-party code; a third-party integration may own the blocking work, and the fix then becomes a vendor conversation or a loading decision rather than a refactor. A third is fixing processing time by moving work to a timer or idle callback, which can shorten one interaction and create a stall later.
The boundary is when INP is the right signal at all. Pages with almost no interaction have little INP to improve, and the effort is better spent on loading or layout stability. Conversely, a page may pass the threshold while a specific, high-value flow - checkout or form submission - remains slow for a small but important group; the aggregate metric will not surface that. INP is a population-level responsiveness signal, not a guarantee about any particular user journey, and it should be read alongside direct observation of the flows that matter commercially.
Diagnoses also need review. Scripts change, vendors update, and traffic mixes shift toward different devices, so the interaction that dominated a trace last quarter may no longer be the constraint. Keep the trace, device profile, and interaction steps with each recorded fix, and set a trigger to recheck when a script bundle or third-party tag changes. Without that, the team accumulates fixes whose rationale nobody can reconstruct, and the next decline starts from zero.
The counterargument that INP is simply a score to push below a threshold is fair as a summary of the target and incomplete as a diagnosis, because the number cannot say which interaction or which phase produced it.
A decision test
- Collect field interactions. Use real-user data where available to find which interactions are actually slow.
- Pick a representative trace. Choose a slow interaction on a device your users actually use.
- Separate the phases. Confirm whether input delay, processing, or presentation consumes the time.
- Assign ownership. Identify whether the blocking task is first-party or third-party code.
- Estimate fix cost. Compare a cheap handler change with the cost of replacing a vendor script.
- Apply and re-measure. Re-run the same interaction on the same device profile and record the delta.
- Set a review trigger. Recheck when scripts, tags, or traffic mix change.
INP optimization is a diagnosis before it is a fix. The sources define the metric and the thresholds, but the value comes from mapping a slow interaction to the phase that consumes its time and the owner who can change it. Record the trace, the device, and the trade-off, and the score becomes an auditable result rather than a number the team chases.
For further reading, see Data Quality in Practice.
References & Further Reading
- web.dev, 2026. Interaction to Next Paint (INP) - web.dev — Core Web Vitals metric for interaction responsiveness.
- web.dev, 2026. Web Vitals — The Core Web Vitals thresholds and what each metric measures.