INP Optimization Costs Explained
INP measures responsiveness across a visit, not a single paint. Read the costs, a worked example, and why a small script can be expensive.
Interaction to Next Paint is often treated as another score to optimise, which hides where its cost comes from. The Web Vitals material defines the metric, and the SRE alerting workbook ties signals to objectives. The cost of improving INP is usually in the main thread, not in the styling.
Direct answer:
Find the interaction that is slow, identify what blocks the main thread, then weigh the engineering cost of each fix against the improvement.
The sources define the metric; the cost rule is a synthesis.
Delta: This article adds a claim-status table and a worked example, separating the documented metric from the local choice of which fix to fund.
The mechanism
Three points matter:
- The metric covers interactions. The Web Vitals material defines INP around user interactions. A page that paints quickly can still respond slowly.
- The main thread is the constraint. Long tasks delay the next paint. The cost of a fix depends on which code runs on that thread.
- Signals need an objective. The SRE workbook argues for alerting tied to objectives. A single slow interaction is noise; a pattern is a signal.
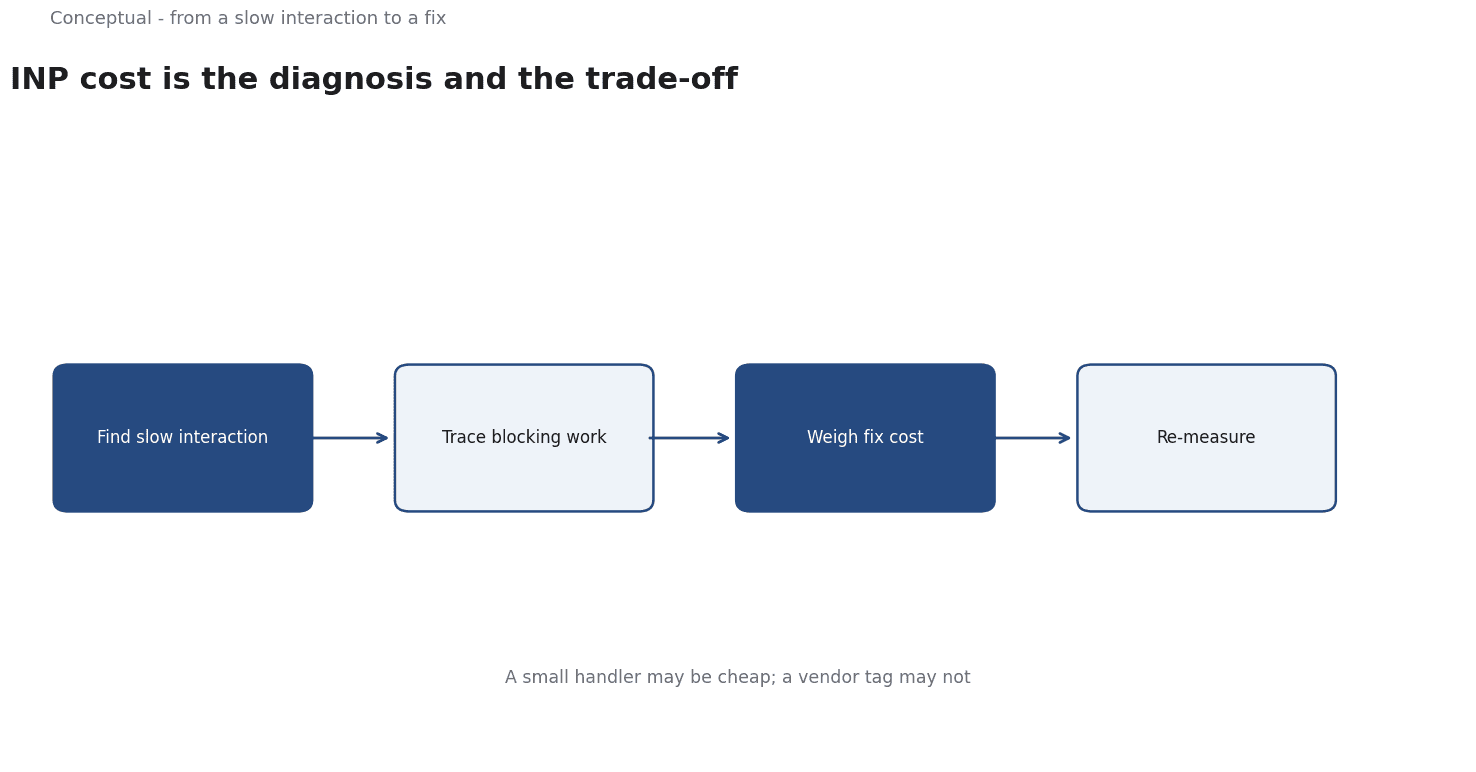
The sequence is: identify the slow interaction, trace the blocking work, then choose a fix. Choosing the fix is local judgement, so it is inferred; the metric definition is source-reported.
A worked example
Illustrative. A page reports poor INP when users open a menu.
Three checks decide. First, which interaction is slow, and on which devices? Second, what long task runs when the menu opens — a third-party script or application code? Third, what does each fix cost, and how much of the interaction does it improve?
The outcome is a prioritised fix with a recorded trade-off. The scenario is hypothetical; the method is the contribution.
Why devices change the answer
An interaction that is fast on a developer machine can be slow on a mid-range phone, where the same JavaScript takes longer to execute.
A realistic device is part of the measurement, not an optional refinement.
The second source of variation is timing. A page that is busy loading may respond slowly to an early interaction and normally once loading finishes. Recording when the interaction occurred helps separate a startup problem from a persistent one, and the two have different fixes.
Why re-measurement is part of the cost
A fix can improve one interaction and worsen another, particularly when it moves work to a different thread. Measuring after the change is the only way to know. The cost of optimization therefore includes the measurement loop, not just the engineering work.
Evidence status
| Claim | Status | Source | Verified | Recheck when |
|---|---|---|---|---|
| INP reflects interaction responsiveness | source-reported | web.dev, Web Vitals | 2026-11-18 | Metric changes |
| Signals should relate to objectives | source-reported | Google SRE workbook | 2026-11-18 | Practice changes |
| Trace blocking work before choosing a fix | inferred | Derived from the metric | 2026-11-18 | Codebase changes |
Why the fix cost varies
Moving a small handler off the main thread may be cheap; rewriting a third-party integration may not. Reporting the improvement without the cost invites a fix that is technically sound and commercially wrong. The comparison belongs in the decision.
A final constraint is that the metric reflects real interactions, not synthetic ones. A test that clicks a button without reading the page will miss the long tasks that occur during genuine use. Field data, where available, is therefore more informative than a laboratory measurement, and the two should be read together.
Optimization also has diminishing returns. The first fix often removes a large blocking task; later fixes address smaller contributors for more effort. Knowing when to stop requires comparing the remaining improvement with the cost, which is a decision the metric alone cannot make.
The decision should also name what would count as success. A reduction in the metric on a fixed set of interactions is a reasonable target, provided the set includes the interactions users actually perform and the devices they use.
A measurement plan that names the target interactions prevents the team from optimising a path nobody uses.
The result should be recorded with the device and interaction used, so a future change can be compared against the same conditions.
What it cannot do
It cannot guarantee a score under other devices. It does not replace tracing, which identifies the cause. And it cannot remove the need to re-measure after a change.
The counterargument that a single score tells the whole story is fair as a summary and incomplete as a diagnosis.
A decision test
- Identify the slow interaction.
- Trace the blocking work.
- Test on realistic devices.
- Estimate each fix's cost and effect.
- Re-measure after the change.
- Record the decision and recheck date.
For the diagnosis, see Core Web Vitals.
References & Further Reading
- web.dev, 2026. Web Vitals — The Core Web Vitals thresholds and what each metric measures.
- Google, 2016. Alerting on SLOs — How to alert on symptoms and burn rate rather than on causes.