Observability: Logging, Metrics, Tracing, Alerting
Observability is the ability to ask new questions of a running system. Read the three signals, the error-budget arithmetic behind good alerts, and what tooling cannot fix.
Monitoring tells you when a known thing breaks. Observability is the stronger property: being able to investigate a problem you did not predict, using evidence the system emitted before anyone knew it mattered. The difference is not a product category. It is whether the data you kept is sufficient to reconstruct an unfamiliar failure.
Direct answer: OpenTelemetry organises telemetry into three signals — traces, metrics, and logs — each answering a different question. Alerting should be derived from service-level objectives rather than raw thresholds: the Google SRE workbook says the goal is "to be notified for a significant event: an event that consumes a large fraction of the error budget", so that teams "respond to problems before [they] consume too much of your error budget". The boundary is that signals and alerts only help if someone owns the response.
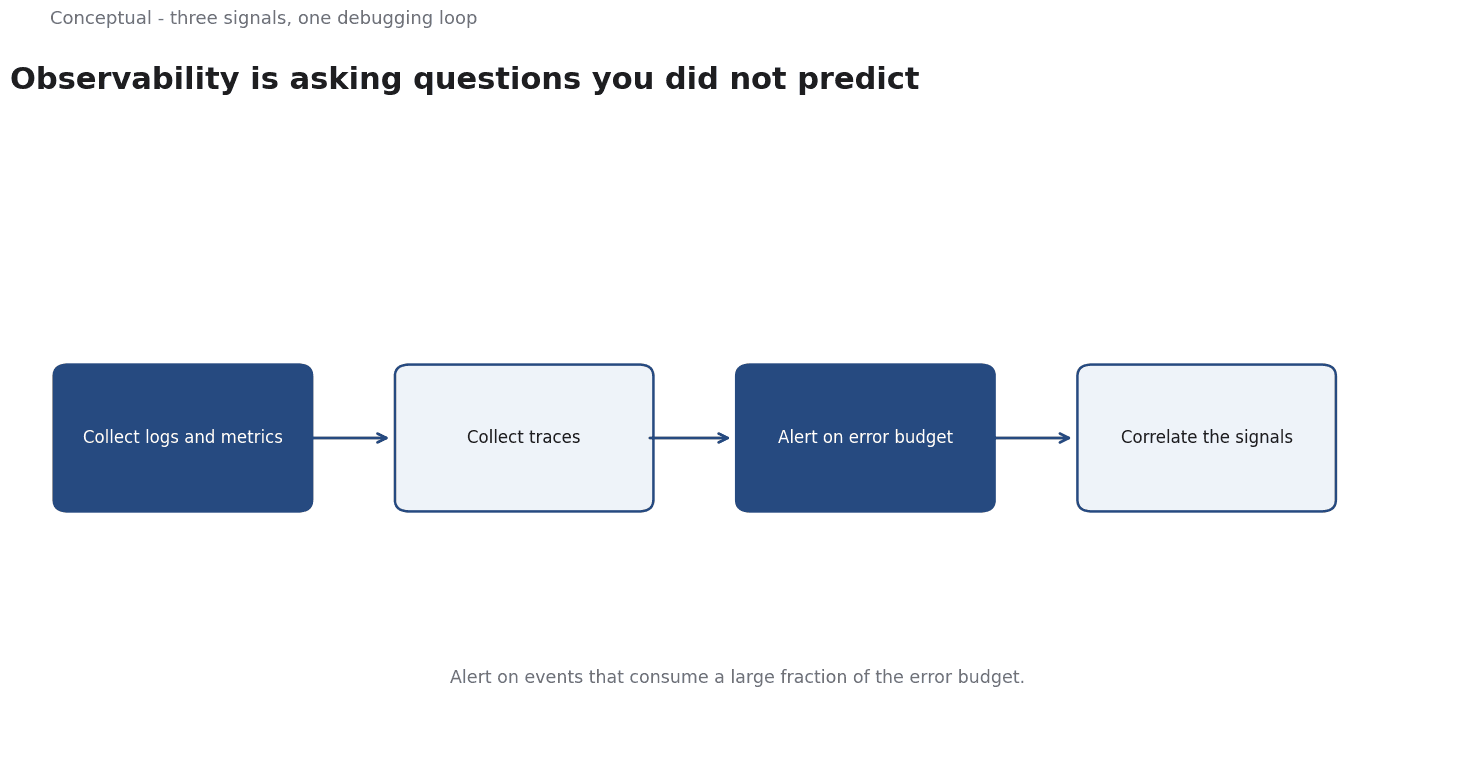
The three signals
Traces follow a request through the services it touches. They answer "where did the time go?" and "which call failed?" A trace is a tree of spans, and its value is the causal structure: a 2-second request is unhelpful until you see that 1.8 seconds were spent in one database call.
Metrics are numeric measurements over time — request rate, error rate, latency distributions. They are cheap to store and excellent for detecting that something changed. They are weaker at explaining why, because aggregation discards the individual events that carried the cause.
Logs are discrete records of events. They carry the detail that metrics lack, but an unstructured log line is hard to query at scale. The practical discipline is to make logs structured and to include the identifiers that let them be correlated with traces.
OpenTelemetry's role is to standardise how these signals are produced and correlated, so that a service emits data in a form any backend can consume. The protocol is the easy part; deciding which attributes to attach — the ones you will wish you had during an incident — is the design work.
Why alerting is a budget problem
An alert that fires on every 5xx spike is easy to write and useless in practice. It produces noise during small, self-correcting blips and trains responders to ignore it. The SRE approach starts from a service-level objective (SLO) and the error budget it implies.
A worked example. Suppose an API has an SLO of 99.9% successful requests per 30-day window. The error budget is 0.1% of requests. If the service handles 1 million requests in that window, the budget is 1,000 failed requests; in time terms at a steady rate, roughly 43 minutes of full outage per month.
Now design alerts from burn rate — how fast the budget is being consumed:
- A fast burn alert: 14.4× the acceptable error rate sustained for 1 hour consumes about 2% of the monthly budget. That warrants a page, because at that rate the budget would be exhausted in about 50 hours.
- A slow burn alert: 6× for 6 hours consumes about 5% of the budget. That warrants a ticket, not a page.
The arithmetic is the point. A 30-second spike at 50× is less serious than 6 hours at 6×, even though the instantaneous error rate is higher, because the second event consumes more of the budget. The SRE workbook's warning that "long detection times can negatively impact the error budget" follows directly.
Three cautions apply:
- Low-traffic services break the arithmetic. A few failures in a quiet period produce enormous error percentages. The SRE workbook explicitly discusses "low-traffic services and error budget alerting" as a sensitive case.
- Symptoms beat causes for paging. Alert on what users experience — latency, errors, availability — not on CPU. A high CPU with healthy responses is not an incident.
- Every alert needs an action. If the responder cannot do anything on receipt, it is a notification, not an alert.
Instrumentation is a design decision
Teams often ask which tool to buy before deciding what to measure. The more useful question is: during a failure, what would you need to know?
For a web service, a reasonable starting set includes:
- The four golden signals — latency, traffic, errors, and saturation — as metrics with labelled dimensions.
- Trace context propagated across services, so a single request can be followed end to end.
- Structured logs with request IDs and the key attributes needed to filter an incident.
- SLOs derived from user experience, with alerts from the error budget rather than fixed thresholds.
- A retention policy that keeps high-value data long enough to investigate slow-burn problems.
The fifth item is where observability programmes usually fail. Detailed traces are expensive, so teams sample aggressively — and then cannot find the one request that explains an incident, because it was discarded. Sampling should be decided with the failure modes in mind, not only the storage bill.
The debugging loop
Observability pays off in a specific rhythm, and it is worth making that rhythm explicit rather than hoping it emerges during an incident.
Notice the symptom. A metric derived from an SLO fires: error rate above the burn-rate threshold, or latency above the user-experienced target. The alert should name the affected user journey, not an internal component.
Form a hypothesis. "If the new cache key is wrong, misses should rise in one segment and the extra calls should appear as a new downstream span." A hypothesis is useful because it tells you which data to query and what would disprove it.
Test against the signals. Check the metric for the segment, find a representative trace, and read the logs correlated with that trace ID. Each signal answers a different part of the hypothesis; using only one is how investigations stall.
Confirm and act. If the data supports the hypothesis, mitigate first and investigate the root cause later. If it does not, discard the hypothesis and form another — but write down what was ruled out, so the next responder does not repeat the work.
This loop is why the three signals must be correlated.
A trace without the relevant log line tells you where the time went but not why; a log without the trace context tells you something happened but not to which request. OpenTelemetry's common identifiers are the mechanism that makes the loop possible.
A game day — deliberately injecting a fault and running this loop — is the only reliable way to find out whether your instrumentation is sufficient. An incident is a poor time to discover that the attribute you needed was never emitted.
What tooling cannot fix
Three limitations are structural.
Unobservable states stay unobservable. If the system never emits a particular attribute, no backend can reconstruct it after the fact. Instrumentation has to anticipate the questions you will want to ask, which is partly a matter of humility about what can go wrong.
More data is not more understanding.
Observability requires hypotheses — "if the cache is cold, latency should rise in this segment" — that the data can confirm or refute.
Alerts require ownership.
An alert with no named responder is an email.
The hardest part of alerting is organisational: deciding who is on call, what counts as significant, and when to escalate.
The counterargument to a heavy observability investment — that it is expensive and most incidents are simple — is fair for small systems. But the cost is a function of scale and criticality, and a team should increase instrumentation as the cost of an undiagnosed incident rises, not when a vendor recommends it.
A decision test
- Define the symptom a user would notice and make it an SLI.
- Derive the error budget from the SLO and alert on its burn rate.
- Emit traces, metrics, and logs with shared identifiers so they can be correlated.
- Alert on symptoms, with a defined action for every page.
- Test the investigation path by running a game day: can you find the cause of an injected fault from the emitted data?
- Review retention against the longest detection window you care about.
For the architecture that creates these problems, see Microservices Architecture; for the response process, see Site Reliability Engineering.
References & Further Reading
- OpenTelemetry, 2026. OpenTelemetry Documentation — The vendor-neutral standard for traces, metrics, and logs.
- OpenTelemetry, 2026. OpenTelemetry Specification — The normative specification behind the SDKs.
- Google, 2016. Alerting on SLOs — How to alert on symptoms and burn rate rather than on causes.
- Charity Majors, 2019. Alerting on SLOs — Symptom-based alerting and why paging on causes is usually wrong.