What ETL Orchestration Actually Measures
ETL moves and reshapes data; orchestration schedules the work. Learn what run metrics report, where they mislead, and which checks support data trust.
Data teams often read a green pipeline dashboard as proof that the data behind a report is correct. The extract, transform, load entry describes the standard process for integrating data from sources into a destination, and the Apache Airflow entry describes a platform for authoring and scheduling workflows. The real problem is that a successful run measures task completion, not data correctness, yet the two are routinely treated as the same thing.
Direct answer: ETL orchestration measures whether scheduled tasks ran and completed within expectations; it does not measure whether the resulting data is accurate, complete, or fit for use. The sources describe the integration process and a workflow scheduler. The gap between task success and data validity is a synthesis.
Delta: This article adds a claim-status table beyond the sources: it maps run status to a data-trust decision, with claim status explicit.
The mechanism
The Wikipedia entry on extract, transform, load describes a process with three stages: extracting data from source systems, transforming it through cleaning, reshaping, and validation, and loading it into a destination such as a warehouse. The practical consequence is that transformation is where much of the quality logic lives, but an orchestrator usually treats a transform as a black box that either exits successfully or fails. The system knows that the step ran; it does not, by itself, know that the meaning of the data survived the step intact.
The Wikipedia entry on Apache Airflow describes a platform for programmatically authoring, scheduling, and monitoring workflows, typically expressed as directed acyclic graphs of tasks with dependencies. The scheduler triggers tasks, manages retries, and records their state. The practical consequence is that orchestration gives strong guarantees about execution order and retry behavior, and weak guarantees about the semantic correctness of outputs. A directed acyclic graph is marked successful when its tasks exit cleanly, which is a statement about process, not about truth.
Read together, the two concepts describe complementary layers. ETL defines the work that must happen to the data; orchestration defines when it runs, in what order, and how failures are handled. The error appears when a green run is read as a statement about the data. A completed run does not establish that the extract pulled all expected rows, that the transform preserved meaning, or that the load wrote to the correct table.
The practical consequence is that orchestration metrics are leading indicators of availability, not indicators of validity, and a pipeline can be perfectly on schedule while producing unusable output.
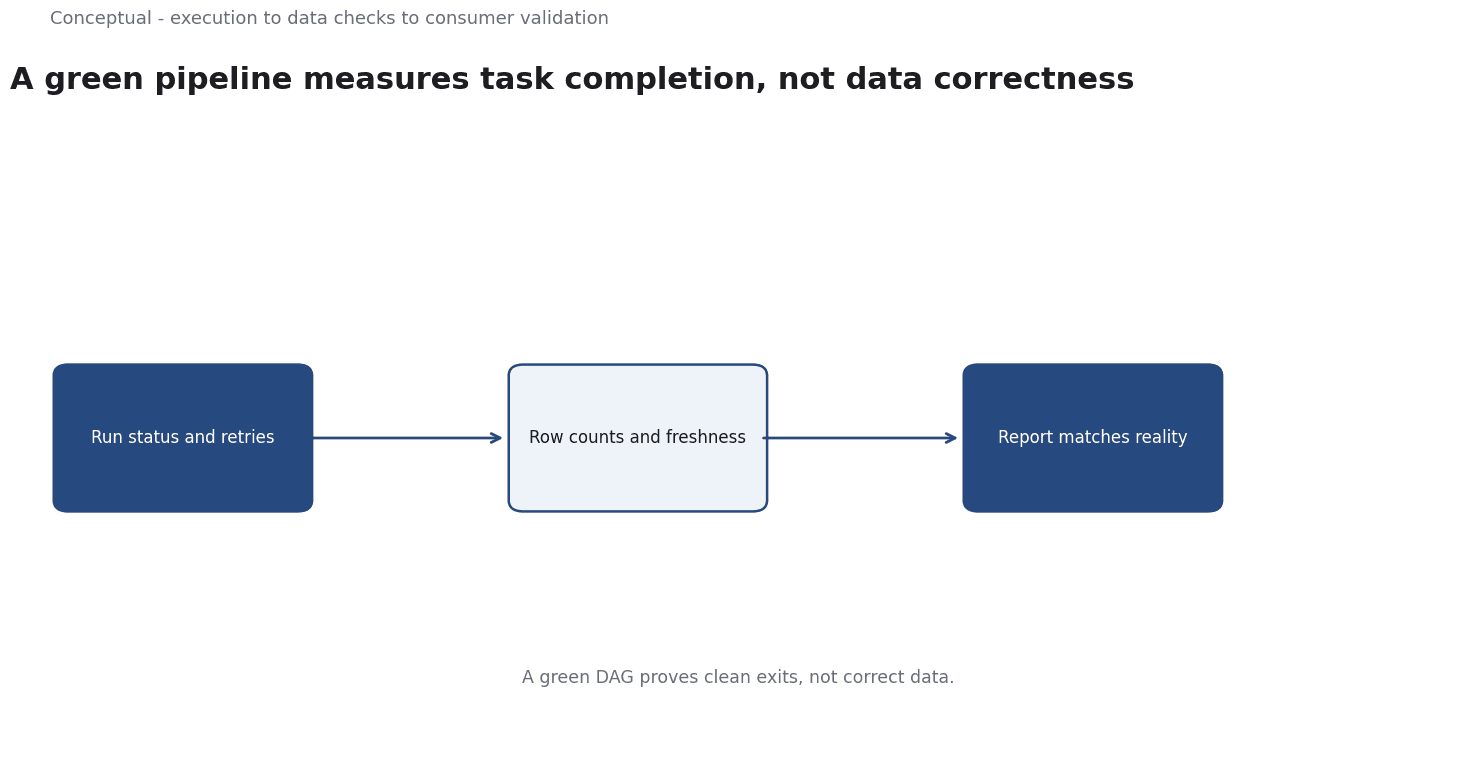
A coherent reading separates three categories of measurement. Execution metrics, such as run status, duration, and retry count, are answered by the orchestrator and describe the mechanics of the job. Data metrics, such as row counts, freshness, null rates, and schema drift, must be answered by checks placed inside the pipeline itself. Business metrics, such as whether a report matches reality, are answered by consumers who use the data. Treating execution metrics as a proxy for the other two is the core failure. That ordering, from execution to data checks to consumer validation, is the mechanism, with each layer answering a different question.
A worked example
The following is hypothetical and illustrative. A daily ETL workflow reports every task green, yet a finance dashboard shows zero revenue for one region. Three checks decide the interpretation. First, inspect row counts and freshness of the loaded table against the previous seven days to see whether volume collapsed silently. Second, check for schema drift after a recent change to an upstream application programming interface. Third, compare a sample of loaded records against the corresponding source records to confirm values match. The outcome: the extract began returning an empty subset after the upstream change, and the workflow stayed green because loading zero rows is a successful task. A volume assertion is added so a future empty load fails loudly. The figures are invented; the sequence of checks is the contribution.
Evidence status
| Claim | Status | Source | Verified | Recheck when |
|---|---|---|---|---|
| ETL extracts data, transforms it, and loads it into a destination | source-reported | Wikipedia, Extract transform load | 2026-11-18 | The definition or scope of ETL changes |
| Airflow schedules and monitors workflows defined as directed acyclic graphs | source-reported | Wikipedia, Apache Airflow | 2026-11-18 | Airflow features or concepts change materially |
| Task success does not guarantee the output data is correct | inferred | Derived from the sources | 2026-11-18 | Built-in data quality checks become a standard feature |
The first two rows are documented in the sources: one defines the integration process, the other the scheduling platform. The third row is an inference from combining them, since neither source claims that a completed task validates its output. Recheck it if orchestration tools begin to enforce semantic data checks as part of a successful run.
What it cannot do
Orchestration cannot validate meaning. It knows exit codes, retry counts, and run durations; it does not know whether a column still represents what it did before a transformation changed, or whether a join silently dropped records. A task that runs on time and finishes cleanly is evidence that the machinery worked, not that the data is right. The limit is structural: the scheduler observes the process boundary, while correctness lives inside the data, which is a different object entirely.
A hidden cost of trusting green dashboards is that they reduce scrutiny. When a pipeline is reported as healthy, downstream checks are less likely to be questioned, so an error can persist until a consumer notices a wrong number. Related to this is alert fatigue: automatic retries that resolve transient failures can train operators to ignore warning signals, and a genuine partial failure can be masked by a retry that eventually succeeds. The cost is paid later, in trust that has to be rebuilt after a visible data incident.
An empty load, a stale table refreshed with yesterday's file, or a schema change that renames a column can all produce a completed run. Retry storms are another failure: a dependency misconfiguration can cause tasks to rerun repeatedly, consuming resources while the dashboard still shows activity. In both cases the orchestrator records behavior that looks normal, so the failure only becomes visible through data-level checks that compare outputs against expectations rather than against the schedule.
The boundary of the measurement ends at the orchestrator. It does not see effects in downstream systems that consume the output, nor logic that runs outside the managed workflow. A table can be loaded correctly and still be misread by a reporting layer with its own transformation rules. Cross-system lineage and consumer-side transformations sit beyond the view of a single workflow, so claims about end-to-end correctness require evidence from every layer, not only from the scheduler that triggered the first task.
These metrics need review whenever source schemas, transformation logic, schedules, or task dependencies change. A duration that was normal last quarter may signal a problem now if an upstream system began returning larger payloads. Versioning workflow definitions and recording schema expectations alongside run history is the practical way to keep the signals comparable. Without that record, a change in the data can be mistaken for a change in the job, or the reverse.
The counterargument that fast, reliable runs are still valuable is fair for availability and operational stability and incomplete for data trust, since a pipeline can be both punctual and wrong without the scheduler ever reporting a problem.
A decision test
- Separate execution metrics from data-quality metrics in every pipeline review.
- Add volume and freshness assertions that fail a run when output is empty or stale.
- Monitor schema drift at each source before transformation begins.
- Compare samples of loaded records against source records on a fixed cadence.
- Check retry counts for patterns that indicate hidden dependency failures.
- Confirm that downstream consumers validate the fields they rely on.
- Version workflow definitions and schema expectations before comparing run history across periods.
These steps keep run status in its proper role as a signal about execution. They do not prove the data is correct, but they catch the most common way that a green dashboard hides a broken output. The result is a data-trust decision based on both the schedule and the substance of what was loaded, with the limits of each made explicit. For further reading, see data quality in practice.
References & Further Reading
- Wikipedia contributors, 2026. Extract, transform, load - Wikipedia — The stages and orchestration of data pipelines.
- Wikipedia contributors, 2026. Apache Airflow - Wikipedia — Orchestration of data pipelines and task dependencies.