What Sell-out Actually Measures
Sell-out compares units sold to units received, but shrinkage and timing can distort it. See what sell-through measures, a worked example, and where the metric can mislead.
Sell-out is frequently read as a clean measure of consumer demand. The Sell-through entry describes the share of inventory sold over a period, and the Shrinkage entry describes losses between recorded and actual stock. The real problem is that sell-out combines genuine sales, timing, and losses into one figure, so a high number can reflect strong demand or simply stock that never reached the shelf.
Direct answer:
Sell-out measures the proportion of received inventory that is sold during a period.
The sources define sell-through and shrinkage but do not set a target or separate the causes of a low or high figure. Sell-out is therefore a signal about inventory movement, not a verdict on why it moved.
Delta: This article adds a claim-status table and a reconciliation test beyond the sources: it maps each component of sell-out to the inventory decision it supports, with claim status explicit.
The mechanism
The Sell-through source describes the percentage of inventory sold relative to the amount received or available over a period. The practical consequence is that the metric connects purchasing to demand, which makes it useful for reorder decisions and for comparing products. A high sell-through rate suggests stock is moving, while a low one suggests inventory is sitting. But the ratio depends on how both the numerator and the denominator are defined, including the period and whether returns are netted out.
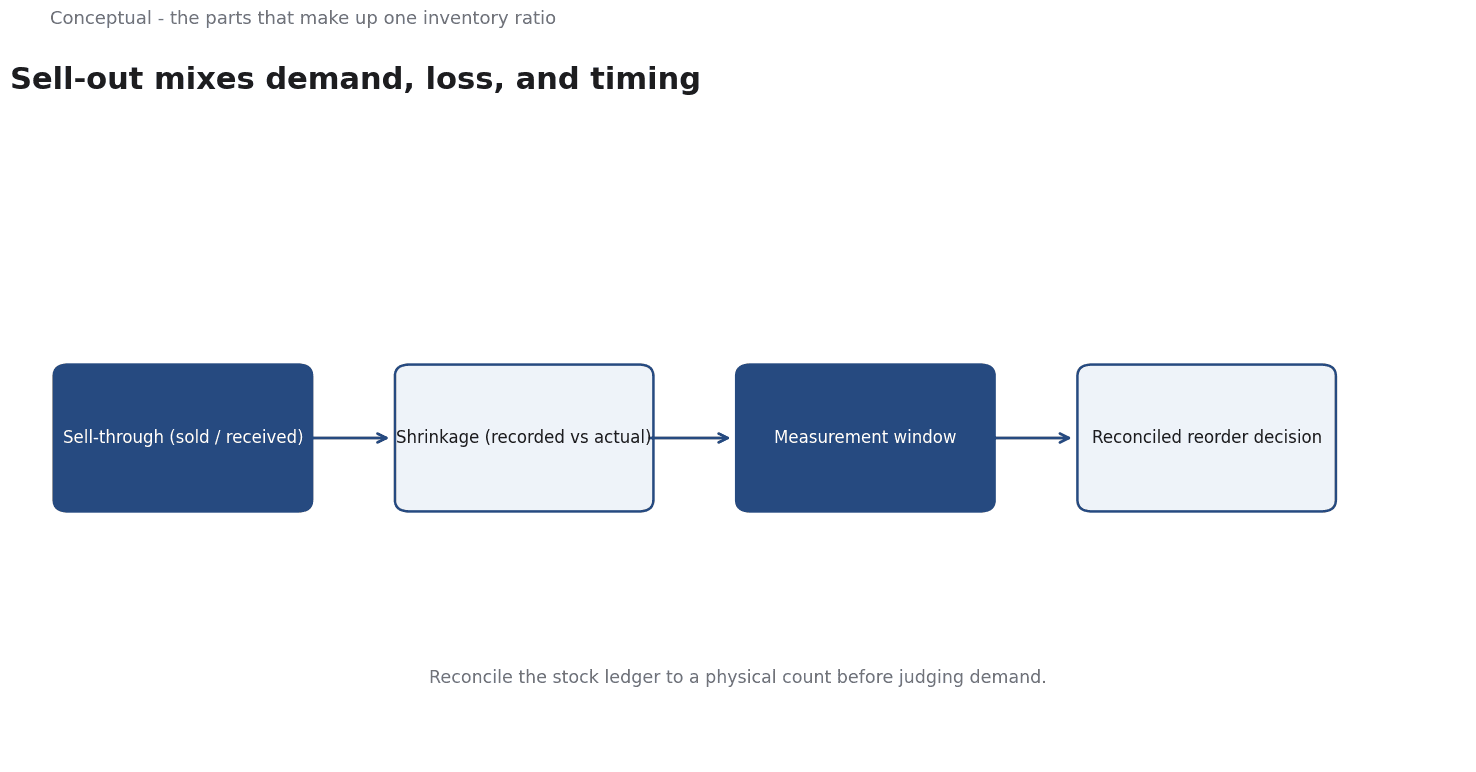
The Shrinkage source describes the difference between recorded inventory and actual physical stock, arising from causes such as theft, damage, or error. The practical consequence is that shrink reduces the goods available to sell without appearing as a sale. If the recorded ledger says a unit was on hand but shrink removed it, sell-through computed against recorded stock can look weak even though the remaining units sold well. The two sources describe related but distinct layers, and conflating them misattributes the cause.
Neither source sets a healthy target or a rule for separating demand from loss. That choice is inferred, not source-reported. A useful discipline is to reconcile the stock ledger against a physical count before interpreting sell-out. When recorded and actual inventory agree, the figure is a cleaner demand signal. When they diverge, the gap should be investigated before the sell-out number is used to reorder or to judge a product.
The consequence for practice is to read sell-out alongside shrink and timing. Sell-through shows how much stock moved, shrink shows how much disappeared, and the period defines the window. Each component should have a definition and an owner so the figure is consistent across products. A sell-out number that ignores shrink or timing can point a buyer toward the wrong reorder, and the sources do not claim it cannot.
A worked example
The following is hypothetical and illustrative. A category manager sees a low sell-out figure for a product and considers cutting the next order. Three checks decide the review. First, does a recent physical count confirm the recorded on-hand inventory, or has shrink removed units from the shelf? Second, was the measurement window unusually short, so that incoming stock had little time to sell? Third, were returns and transfers netted consistently, so the numerator reflects genuine sales? The review finds that shrink accounts for much of the gap and that a late delivery compressed the window. The manager adjusts the reorder instead of cutting it. The figures are hypothetical; the verification method is the contribution.
Evidence status
| Claim | Status | Source | Verified | Recheck when |
|---|---|---|---|---|
| Sell-through measures the share of inventory sold over a period | source-reported | Wikipedia, Sell-through | 2026-11-18 | Definition revised |
| Shrinkage is the gap between recorded and actual stock | source-reported | Wikipedia, Shrinkage | 2026-11-18 | Definition revised |
| Shrink and timing can distort sell-out as a demand signal | inferred | Derived from the sources | 2026-11-18 | Inventory controls change |
The first two rows restate definitions from the sources. The third row is a synthesis, since neither source connects shrink to the interpretation of a sell-out figure. Recheck when the definitions change, or when physical-count accuracy, delivery timing, or return handling shifts.
What it cannot do
Sell-out cannot tell you why inventory moved. It is a ratio of units sold to units available, not an explanation of demand. The Sell-through source describes the measure, not the causes behind it. A low figure can mean weak demand, excess stock, a short measurement window, or losses that never became sales. A manager who reads the number as a demand verdict mistakes an inventory ratio for a diagnosis.
The hidden cost lies in the quality of the underlying records. If the stock ledger is wrong, the denominator is wrong and the whole ratio is unreliable. The Shrinkage source describes losses between recorded and actual stock, which is exactly the gap that corrupts the figure. Investigating that gap with physical counts takes effort that the sell-out number does not require, and a team that skips it saves work at the cost of accuracy.
Products with different lead times, return policies, or measurement windows produce ratios that are not comparable. A change in how returns are netted can move the figure even when underlying demand has not changed. Because the sources define the measures but do not discuss comparability, this risk is an inference from the gap between definition and use.
There is a boundary around what sell-out covers. It reflects recorded unit movement over a period, not margin, customer satisfaction, or the reason a product sold. It also says nothing about price promotions, which can lift units while reducing profit, or about stock that arrives late and never had a chance to sell. A metric that ignores these factors is a partial view, and the sources do not claim otherwise.
Because stock records and timing change, sell-out needs periodic review. The stock ledger should be reconciled against physical counts, the measurement window should be confirmed, and return handling should be checked, with definitions and recheck dates recorded alongside the figure. Without that record, a stable-looking sell-out number can conceal growing shrink until a stockout makes it visible. A reviewer should be able to see what the ratio included and when it was last questioned.
The counterargument that sell-out is fair for a quick reorder signal is incomplete when it is used to explain why units did or did not sell.
A decision test
- Name the reorder or range decision the figure is meant to inform.
- Confirm the measurement window and how returns are netted.
- Reconcile the stock ledger against a recent physical count.
- Compute sell-through from consistent received and sold units.
- Separate units lost to shrink from units genuinely sold.
- Decide to reorder, hold, or investigate based on the reconciled figure.
- Record definitions, owners, and recheck dates with the metric.
Sell-out is a signal about inventory movement, not an explanation of demand. The test ties the figure to a reorder decision and makes records, shrink, and timing visible, so a reviewer can see when a low number means weak demand and when it means stock that never reached the shelf. For further reading, see Marketing Dashboards without the Hype.
References & Further Reading
- Wikipedia contributors, 2026. Sell-through - Wikipedia — Share of inventory sold from channel.
- Wikipedia contributors, 2026. Shrinkage (accounting) - Wikipedia — Inventory loss and its causes in retail.