Marketing Dashboards without the Hype
A dashboard should change a decision. Read what to show, a worked redesign, and why more charts can mean less understanding.
Most marketing dashboards are collections of charts that report activity. They update daily, look authoritative, and rarely change a decision, which is why a team can watch one for months and still make the same mistakes. The problem is not the data but the absence of a question the dashboard is meant to answer.
Direct answer:
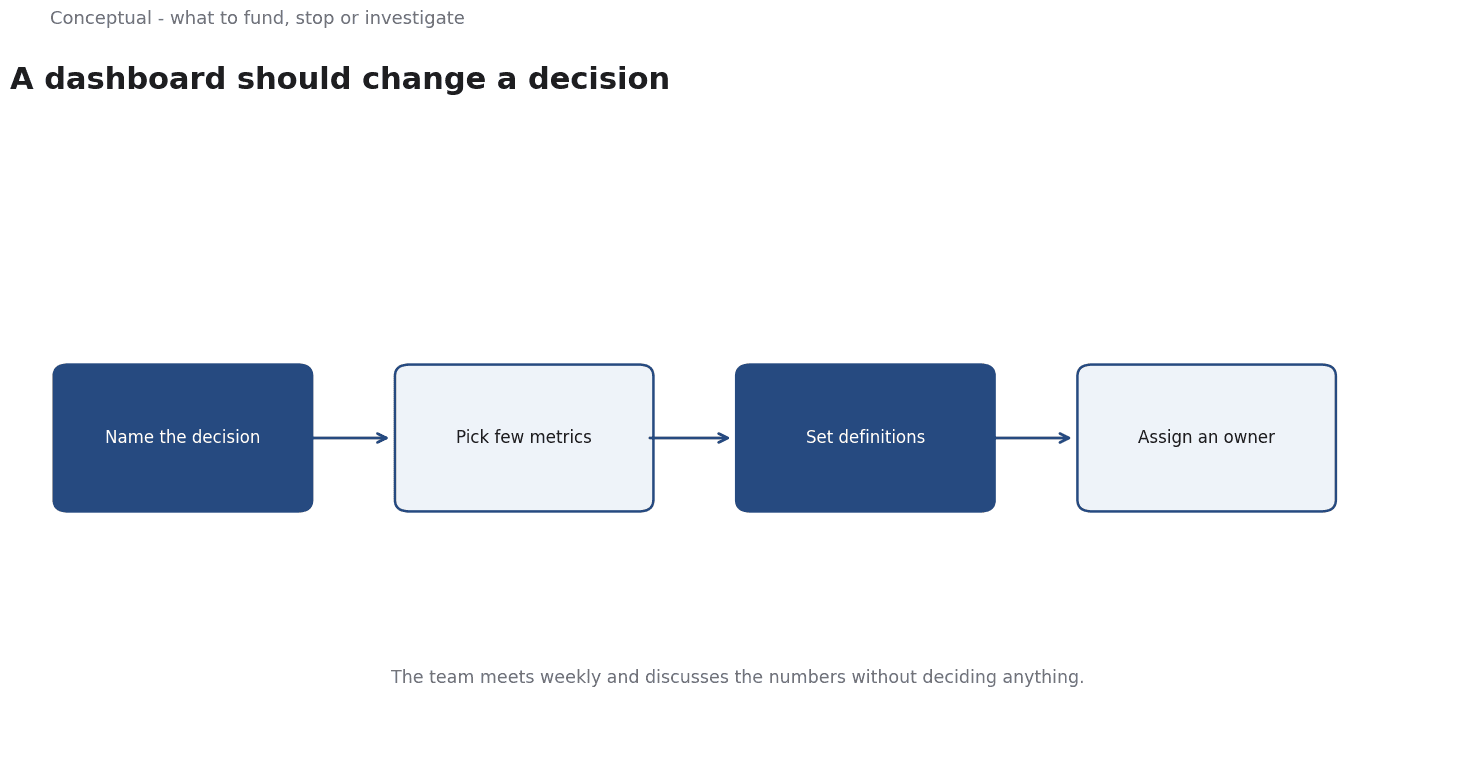
Build a dashboard around decisions — what to fund, what to stop, what to investigate — with a small number of metrics that have a definition, a baseline, and an owner.
The dashboard overview provides the context for at-a-glance metrics, and AAPOR's standards apply to any survey-based number shown. The boundary: no dashboard guarantees a result, which the publication standard states for marketing claims, and a metric without a decision is decoration, as the evaluation-rubric article argues for criteria tied to action.
What to show
A primary metric per decision. If the dashboard governs spend, show cost per qualified opportunity, which the marketing-budget article treats as an allocation input. If it governs retention, show repeat purchase by cohort, as the retention article advises. One dominant measure prevents the team from choosing whichever number looks best.
A trend with a baseline. A number without a comparison is hard to interpret, which the brand-lift article explains for separating effect from background. Show the dated series and the prior period, as the data-governance article requires for relied-upon figures.
A leading indicator and a guardrail. Clicks or engagement can warn of a change, while complaints or unsubscribes limit how far a team can push, as the email-metrics article argues for metrics alongside guardrails.
An owner and a review date. A dashboard that nobody owns becomes stale, which the governance checklist treats as an accountability gap, as the monitoring article warns for any maintained standard.
Three consequences follow. Fewer charts are easier to use, which the dashboard overview treats as the point of an at-a-glance display. Definitions must be visible, as the data-governance article requires. And the number of metrics should reflect the number of decisions, not the number of available fields, which the evaluation-rubric article argues for criteria with a purpose.
A worked redesign
The following is hypothetical and illustrative. A dashboard shows twenty charts: impressions, clicks, opens, clicks by channel, follower counts, page views, and more.
A redesign asks which decisions the meeting should make. Two emerge: where to place next month's budget, and which campaigns to stop. The new dashboard shows three things: cost per qualified opportunity by channel with a twelve-week trend; the same measure against a baseline; and a guardrail of complaint and unsubscribe rates, as the email-metrics article advises. Three checks decide whether it works. First, does the meeting make a recorded decision, as the decision-memo article requires? Second, does the primary metric change after the decision, which the attribution article treats as an outcome rather than a credit rule? Third, are definitions stable, as AAPOR's standards require for comparable wording?
Three conclusions follow. The redesign trades volume for relevance, which the dashboard overview recommends. The guardrail prevents a local optimisation that damages trust, as the email-metrics article advises. And the decision record makes the dashboard accountable, as the governance checklist requires.
What dashboards cannot do
They cannot establish causation, which the attribution article treats as a counterfactual question. They cannot fix a bad metric, as the evaluation-rubric article argues for explicit criteria. And they do not replace investigation: a trend tells you where to look, not why, which the observability article separates from the cause of a failure.
The counterargument that executives want many charts is rarely true.
They want access to detail with a decision in front of them, which the five-minute-update article argues for in communication.
A decision test
- Name the decisions the dashboard must support.
- Choose one primary metric per decision.
- Show a dated trend against a baseline, as the data-governance article requires.
- Add a leading indicator and a guardrail, as the email-metrics article advises.
- Show definitions, as AAPOR's standards require for survey-based numbers.
- Assign an owner and a review date, as the governance checklist requires.
- Record the decisions made from it, as the decision-memo article advises.
For the measurement frame, see Marketing Attribution; for the metric standard, see Email Marketing Metrics.
References & Further Reading
- Wikipedia contributors, 2026. Dashboard (computing) - Wikipedia — The role of dashboards in presenting metrics at a glance.
- American Association for Public Opinion Research, 2026. AAPOR — The professional association for public opinion and survey research; its standards and resources underpin the survey-design discussion.