Channel Conflict Metrics that Matter
Channel conflict mixes competition with coordination. Read which metrics expose real friction, a worked example, and why a single score hides the cause.
Channel conflict is often reduced to a complaint count, which misses the structural friction behind it. The Wikipedia entry on channel conflict describes disputes that arise between channel partners, and the marketing communications entry describes how messages reach audiences through a mix of channels. The real problem is choosing metrics that reveal the cause rather than the noise.
Direct answer: Channel conflict metrics should capture overlap, response speed, and margin erosion between partners, not just complaint volume. The sources describe conflict and communication channels; the choice of which metrics to trust is a synthesis. No single number captures the cause.
Delta: This article adds a claim-status table beyond the sources: it maps channel roles to a metric decision, with claim status explicit.
The mechanism
The channel conflict entry describes friction that arises when partners in a distribution system compete over the same customers or resources, including vertical conflict between a producer and its resellers and horizontal conflict among resellers.
The practical consequence is that any metric which only counts disputes records the symptom after damage is done, while structural overlap can be observed before it becomes a complaint.
The marketing communications entry describes the mix of methods used to communicate with audiences, such as advertising, sales promotion, public relations, and personal selling, coordinated under integrated marketing communications. The practical consequence is that each channel carries a distinct message and role, so conflict often appears when those roles blur and two channels make competing promises to the same buyer.
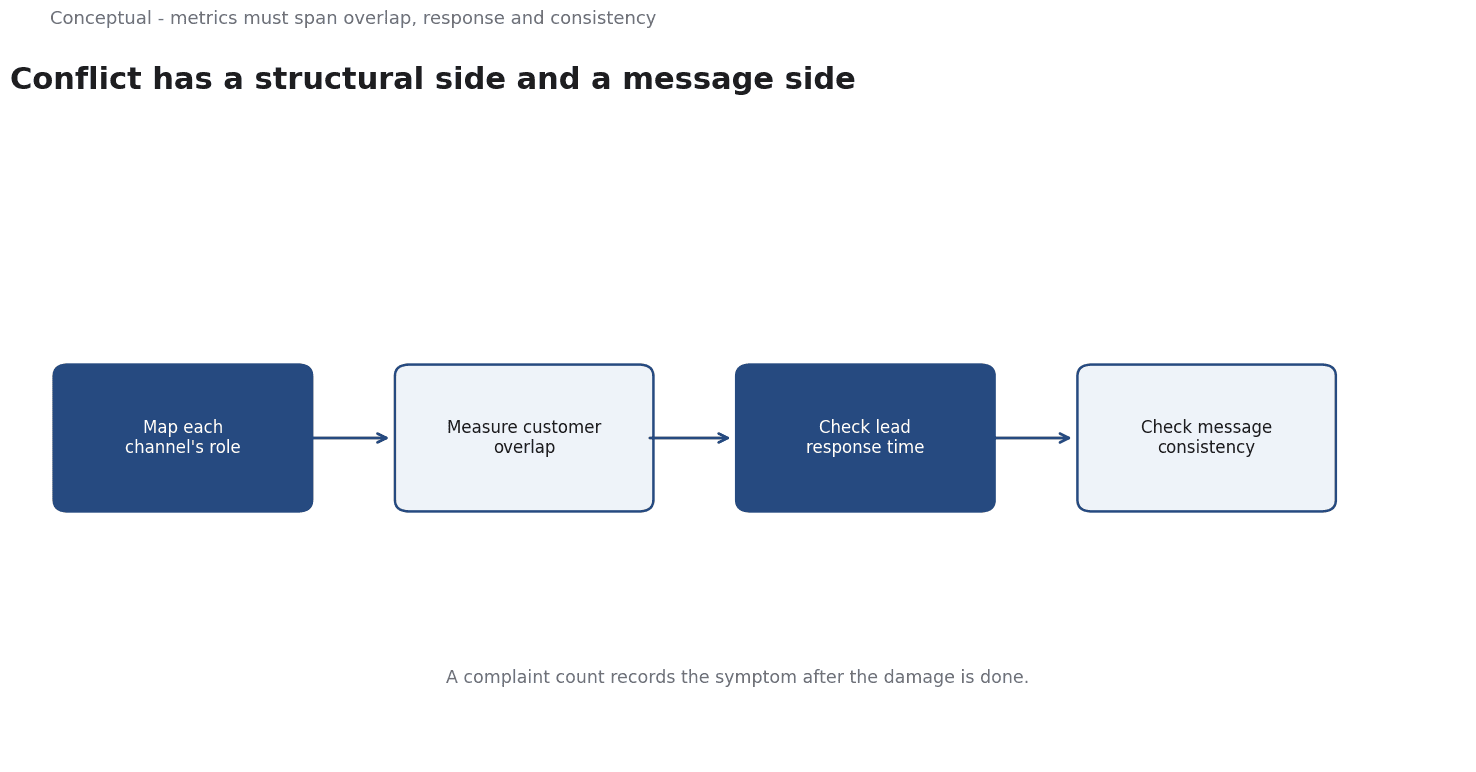
Combining the two, conflict has a structural side, meaning overlap in customers and roles, and a communicative side, meaning inconsistent messages. Metrics must span both. Overlap metrics detect where channels compete; response metrics detect how quickly leads are handled; message-consistency checks detect conflicting promises. A dashboard that tracks only order counts will miss all three.
The practical ordering is to map channel roles first, then measure where roles overlap, then check whether communication is consistent. Each step converts an abstract conflict into an observable quantity. Because the sources define conflict and channel types but do not prescribe metrics, the metric selection is an inference layered on documented concepts, and it should be stated as such.
A worked example
The following is hypothetical and illustrative. A manufacturer sells through independent retailers and also operates a direct online store, and notices falling retailer orders. Three checks decide what is happening. First, measure customer overlap: if the direct store and the retailers draw from the same zip codes, structural overlap is present. Second, check lead response time: if online leads are followed up faster than retailer-generated leads, the direct channel is winning on speed rather than on value. Third, compare message consistency: if the direct store advertises prices that retailers cannot match, the conflict is communicative. The outcome is a targeted response, such as clarifying which channel owns which customer segment, rather than a blanket discount. The figures are hypothetical; the diagnostic sequence is the contribution.
Evidence status
| Claim | Status | Source | Verified | Recheck when |
|---|---|---|---|---|
| Channel conflict can arise between partners over shared customers | source-reported | Wikipedia, Channel conflict | 2026-11-18 | Distribution models change |
| Marketing communications span multiple coordinated channel types | source-reported | Wikipedia, Marketing communications | 2026-11-18 | Channel definitions change |
| Overlap, response, and message metrics expose causes of conflict | inferred | Derived from the sources | 2026-11-18 | New measurement research appears |
The first two rows restate documented concepts: one describes conflict, the other the communication mix. The third row is an inference, because neither source recommends a specific metric. Recheck it if channel structures shift or if new evidence links particular measures to conflict resolution.
What it cannot do
No metric proves that conflict is the cause of a performance decline. Falling retailer orders can reflect seasonality, a competitor, or a product issue just as readily as channel friction. Metrics narrow the possibilities but do not establish causation, and a spike in overlap measurements does not by itself show lost revenue. A manager who treats the metric as proof will act on an assumption.
A hidden cost of measuring conflict is that measurement can intensify it. When partners are scored on metrics they do not control, such as lead response time influenced by central routing, they may optimise locally in ways that worsen the overall system. The act of instrumenting a channel changes behavior, so the metric is not a passive observer. What begins as a neutral report can become a pressure on relationships.
Complaints are a lagging indicator, appearing after trust has eroded, and vocal partners are not representative. A dashboard dominated by complaint counts will always react late, and it will over-weight the most outspoken relationships while quieter problems grow unnoticed in the background.
The boundary is the visibility of the data. Overlap and message consistency can only be measured where the organisation can see both channels. Partner data shared reluctantly or aggregated loosely leaves blind spots, so the metrics describe the observable portion of the system, not the whole network. Conclusions drawn from partial visibility should be labelled as such.
These metrics need review whenever the channel mix or agreements change. Adding a new reseller, altering a pricing policy, or changing a routing rule can invalidate a baseline. Each metric should be dated and tied to the channel structure it describes, otherwise a trend may reflect a structural change rather than a change in behavior. Without that link, comparison across periods is unreliable.
The counterargument that a single conflict score is easier to manage is fair for high-level reporting and incomplete for diagnosis, because an aggregate hides which channel pair and which cause require action.
A decision test
- Map the roles assigned to each channel.
- Identify where two channels target the same customers.
- Measure lead response time by channel.
- Check message and price consistency across channels.
- Separate lagging complaint data from leading overlap data.
- Confirm data visibility for every channel in scope.
- Record the channel structure alongside each metric before comparing periods.
These steps turn a vague complaint into a bounded decision about where to intervene. They will not resolve the conflict, but they prevent a team from treating a symptom as the cause. The metric only supports a decision when the channel structure behind it is recorded and still current. For further reading, see voice of customer turning feedback into decisions.
References & Further Reading
- Wikipedia contributors, 2026. Channel conflict - Wikipedia — Disputes between channels serving the same customer.
- Wikipedia contributors, 2026. Marketing communications - Wikipedia — The coordination of messages across channels and the distinction between consistent and identical communication.