Churn Reduction Examples
Churn has different causes in different cohorts. Read worked examples, a worked diagnosis, and why a blanket discount can hide the problem.
Churn reduction is often treated as a single programme, which ignores that different cohorts leave for different reasons. The customer-retention entry describes efforts to keep customers, and the cohort entry covers grouping by shared start period. The example matters because a cause found in one cohort may not apply to another.
Direct answer: Diagnose churn by cohort, identify where the drop occurs, test one intervention, and measure against a comparison. The sources define retention and cohorts; the diagnostic sequence is a synthesis.
Delta: This article adds a claim-status table and worked examples, separating documented concepts from the local choices in a retention intervention.
The mechanism
Three steps matter:
- Cohort first. The cohort entry describes grouping by a shared period. Aggregated churn can hide a recent cohort that is much worse.
- Behaviour before intention. The retention entry concerns keeping customers, which is observable. A stated reason for leaving is useful but secondary.
- Comparison before credit. An intervention that coincides with a seasonal uptick may appear effective. A comparison group is the causal-inference correction.
The sequence is: split by cohort, locate the drop, choose one intervention, compare.
Choosing the intervention is judgement, so it is inferred; the concepts are source-reported.
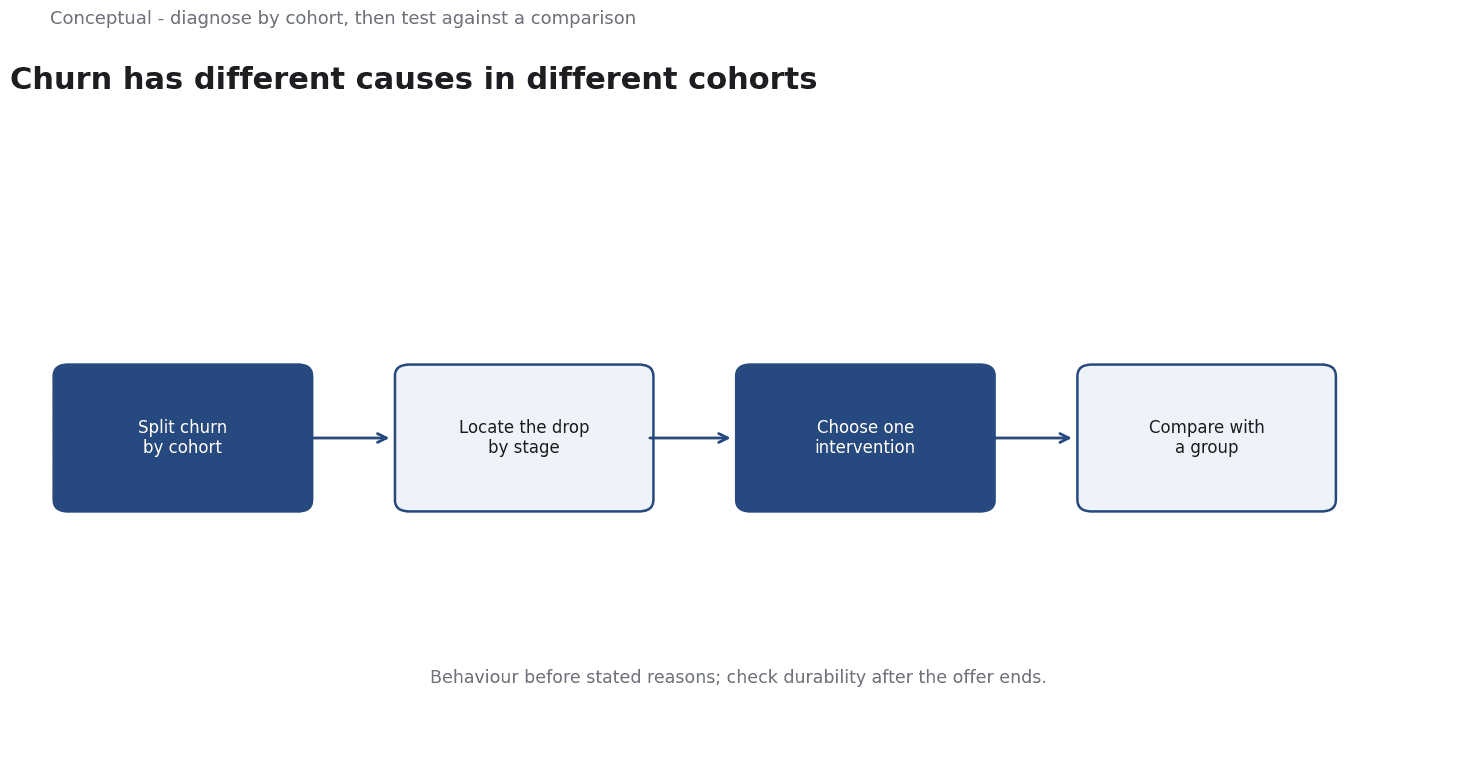
Worked examples
Illustrative. A subscription business sees overall churn of 8% and a recent cohort at 14%.
Three checks decide. First, does the recent cohort differ in acquisition channel or onboarding? Second, where in the journey does the drop occur — before first use or at renewal? Third, if a discount is offered, does it produce retained customers after the offer ends, compared with a group that received nothing?
A second example: a B2B service sees churn concentrated among small accounts. The same checks apply, but the cause may be a missing setup step rather than price.
The outcome is a targeted intervention with a comparison. The numbers are hypothetical; the diagnostic sequence is the contribution.
Why the stage matters
A customer who leaves before first use has a different problem from one who leaves at renewal. The first may never have understood the value; the second may have understood it and found the price no longer justified. A single churn rate combines both and points to neither.
Locating the stage is usually possible from product events: activation, first value, and renewal. Once the stage is known, the next question is whether the cause is a product gap or a mismatch in expectations. A customer who never reaches first value may have been sold something different from what the product does, which is an acquisition problem appearing as retention.
Why durability is part of the measurement
An intervention that appears to retain customers for one billing cycle may simply delay cancellation. Checking the same cohort after a second cycle separates a real change from a temporary one. This matters because a short-lived retention can still look successful in the reporting window, and the cost of the intervention has already been paid.
Evidence status
| Claim | Status | Source | Verified | Recheck when |
|---|---|---|---|---|
| Retention concerns keeping customers | source-reported | Wikipedia, Customer retention | 2026-11-18 | Definition revised |
| Cohorts group users by a shared period | source-reported | Wikipedia, Cohort analysis | 2026-11-18 | Definition revised |
| Diagnose by cohort before intervening | inferred | Derived from the two concepts | 2026-11-18 | Acquisition mix changes |
Why a blanket discount misleads
It also resets the reference price, which can make future renewals harder. A targeted intervention based on a diagnosed cause is usually cheaper and easier to evaluate.
The examples also show why a single metric is insufficient. A cohort can have the same churn rate as another while losing customers at a different stage, and the two require different responses. Reporting the rate by stage is therefore more informative than reporting it by customer, and it is the view that a product team can act on directly. When that view is missing, teams tend to choose interventions based on the most visible symptom rather than the most common cause, which is an expensive way to learn about their own product.
The date of the cohort matters as much as its label, because acquisition conditions change over time.
What it cannot do
It cannot prove that an intervention caused retention without a comparison. It does not guarantee that a cause found in one cohort applies to another. And it cannot remove the need for a product worth keeping.
The counterargument that a simple discount is faster is fair for a quick test and incomplete as a durable strategy.
A decision test
- Split churn by cohort.
- Locate the drop by stage.
- Check behaviour before stated reasons.
- Choose one intervention.
- Compare against a group.
- Check durability after the offer.
- Record the decision and the recheck condition.
For the economics, see Customer Retention.
References & Further Reading
- Wikipedia contributors, 2026. Customer retention - Wikipedia — Efforts to keep existing customers.
- Wikipedia contributors, 2026. Cohort analysis - Wikipedia — Grouping users by shared start period for comparison.