Circular Economy Metrics that Matter
How to choose circular economy metrics tied to real material flows, reverse logistics and design decisions, and why a single recycled-content figure misleads.
Organisations often report circular economy progress with a single recycled-content percentage, which says little about whether materials are actually kept in use. The circular economy entry describes a system aimed at keeping products and materials in circulation, and the reverse logistics entry covers the movement of goods back from the customer. The practical problem is choosing metrics that connect those ideas to decisions about design, returns and recovery rather than to a public-facing number.
Direct answer: Measure circularity with a small set of flow metrics: the share of material that re-enters use, the return rate of products, the recovery yield from returns, and the share of design that enables repair or reuse. Each metric needs a defined boundary and an owner. The test is whether the number changes a decision, not whether it looks good in a report.
Delta: This article adds a claim-status table and a worked example beyond the sources: it maps the loop-closing idea and the reverse-flow mechanics to a specific metric choice, with claim status made explicit.
The mechanism
The circular economy entry frames the goal as keeping products, components and materials at their highest utility, cycling technical and biological materials back into use. The practical consequence is that a useful metric tracks a flow over time rather than a one-time attribute. Recycled content at a point in time is a snapshot of what went into a product; circulation is about what happens after.
A metric that measures only the input side cannot tell you whether a loop was actually closed, which is the central claim of the concept.
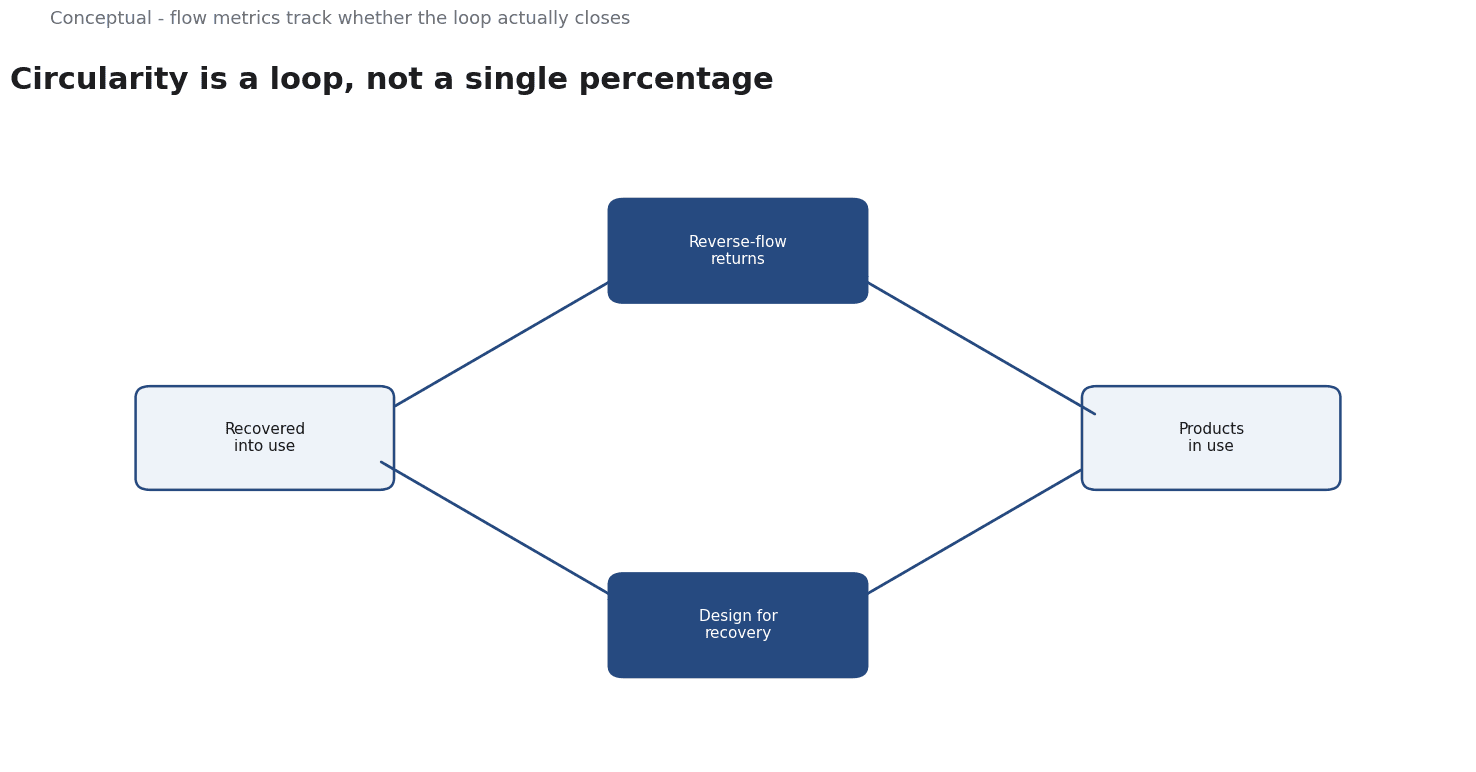
Reverse logistics is the process of moving goods from the customer back toward the producer for return, repair, refurbishment or recycling. The consequence is that without a functioning reverse flow, upstream circular design goals never materialise. Return rate and recovery yield are therefore leading indicators: they tell you whether the physical loop exists at all. A company can design for durability and still recover nothing if no channel brings the product back, so the reverse flow is the first place to look when a circularity claim is made.
Design decisions set the ceiling on what recovery can achieve. Choices about durability, repairability, material purity and disassembly determine how much value can be recovered later. The consequence is that recovery yield is bounded by design; a product that cannot be taken apart will have poor recovery no matter how good the reverse logistics are. This is why a design-stage measure belongs alongside operational measures. It separates a problem created by the product from a problem created by the collection system, and each has a different owner and a different fix.
Every metric also needs a boundary: which product, which region and which time window. Without that, two teams can report different numbers for the same system and argue about which is correct. The consequence is practical: define the denominator before the numerator, and keep lead measures such as return rate separate from lag measures such as recovered material. When those are mixed into one headline figure, the number becomes easy to quote and hard to act on, which defeats the purpose of measuring in the first place.
A worked example
The following is hypothetical and illustrative. A retailer wants to report circularity for a line of small appliances and currently publishes only the recycled content of new units. Three checks reshape the metric set. First, define the loop: which products and which region, and over what window? Second, does a reverse flow exist, and what are the return rate and the share of returned units that are actually repaired or recycled? Third, can the product be disassembled for repair, and how much value is retained after recovery? The outcome is a small set of flow metrics with owners instead of one figure. The numbers are illustrative; the sequence is the contribution.
Evidence status
| Claim | Status | Source | Verified | Recheck when |
|---|---|---|---|---|
| Circular economy aims to keep products and materials in circulation | source-reported | Wikipedia, Circular economy | 2026-11-18 | Definition or framework revised |
| Reverse logistics moves goods back for return, repair or recycling | source-reported | Wikipedia, Reverse logistics | 2026-11-18 | Source revised or scope changed |
| Flow metrics with a defined boundary beat a single recycled-content figure | inferred | Derived from the sources | 2026-11-18 | Product mix or reporting standard changes |
Two rows report what the sources describe: the aim of keeping materials in circulation, and the reverse movement of goods. The third row is a local judgement, inferred rather than reported, that bounded flow metrics are more useful for decisions than a single content figure. It should be revisited when the product mix or the reporting standard changes.
What it cannot do
A circularity metric cannot prove that a system is circular. It measures a flow, not the sustainability of the whole system. A high recovery yield can coexist with growing virgin input if total volumes rise fast enough, so a single improving percentage can sit alongside a worsening absolute impact. The claim should be bounded to the flow actually measured.
There is a hidden cost in the reverse flow. Collection, transport, inspection and sorting are expensive, and a high return rate can be a cost problem if most returns cannot be recovered economically. Metrics that celebrate returns without recording the net value of recovery can reward the wrong behaviour: it is possible to improve the return rate while losing money on every returned unit. The operational measure has to include what happens after the product comes back, not just that it did. Otherwise the metric rewards activity rather than outcome.
A specific failure mode is downcycling. Material recovered into a lower-value use still counts as recovered by a mass-based metric, even though each loop reduces its value. A recovery figure that ignores quality therefore overstates circularity and can make a linear, value-destroying chain look circular. Tracking value retention, not only mass, closes that gap. The practical consequence is that two metrics are needed where one was assumed: one for the quantity that returns, and one for the value that survives the return.
There are boundaries where circularity metrics should not be the lead measure. When a product's use phase dominates its total impact, material circularity can distract from the larger lever. Energy-using products are the common case: improving recovery of materials can be real progress and still be smaller than reducing energy consumed during use. Circularity is not the same as lower total impact. Applying the metric where it is not the binding constraint produces a tidy report and a missed opportunity, so it is worth asking which phase actually dominates before choosing the headline.
Finally, these metrics need review because products, supply chains and standards change. A measure chosen for one product family can become misleading after a design change or a new recovery route. Assign an owner and a recheck date, and revisit the boundary along with the number. Without that, a metric can be gamed or simply become stale, and a figure that once guided decisions becomes a ritual that nobody trusts but nobody removes.
The counterargument that a single headline figure is useful for communication is fair for raising awareness and incomplete for running an operation.
A decision test
- Define the loop boundary: product, region and time window.
- List the reverse flows that actually exist today.
- Measure return rate and recovery yield at that boundary.
- Add a design-stage repairability or disassembly check.
- Track value retention, not just recovered mass.
- Assign an owner and a recheck date to each metric.
- Drop any metric that never changes a decision.
The point of the test is to keep the metric set small and answerable. A handful of measures with clear owners will outlast a broad dashboard that nobody maintains. Each decision to keep a metric should be tied to a decision it changes, and the recheck date ensures the boundary is still the right one when the product or the market moves.
For further reading, see Data Quality in Practice.
References & Further Reading
- Wikipedia contributors, 2026. Circular economy - Wikipedia — Systems that keep materials in use.
- Wikipedia contributors, 2026. Reverse logistics - Wikipedia — Overview of product returns, reusable packaging and unsold-goods flows; secondary reference used with NRF and Census data.