Classification Metrics Beyond Accuracy: Baselines, ROC-AUC, and Paired Tests
Accuracy alone cannot tell you whether a classifier learned anything. How to choose an honest baseline, read ROC-AUC, compare paired predictions, and stop a p-value from doing more work than it can.
Accuracy is the first metric everyone learns and the last one most teams should quote alone. A classifier that predicts the majority class every time can look respectable on an imbalanced problem, and a classifier that beats that baseline by one point may have found nothing at all.
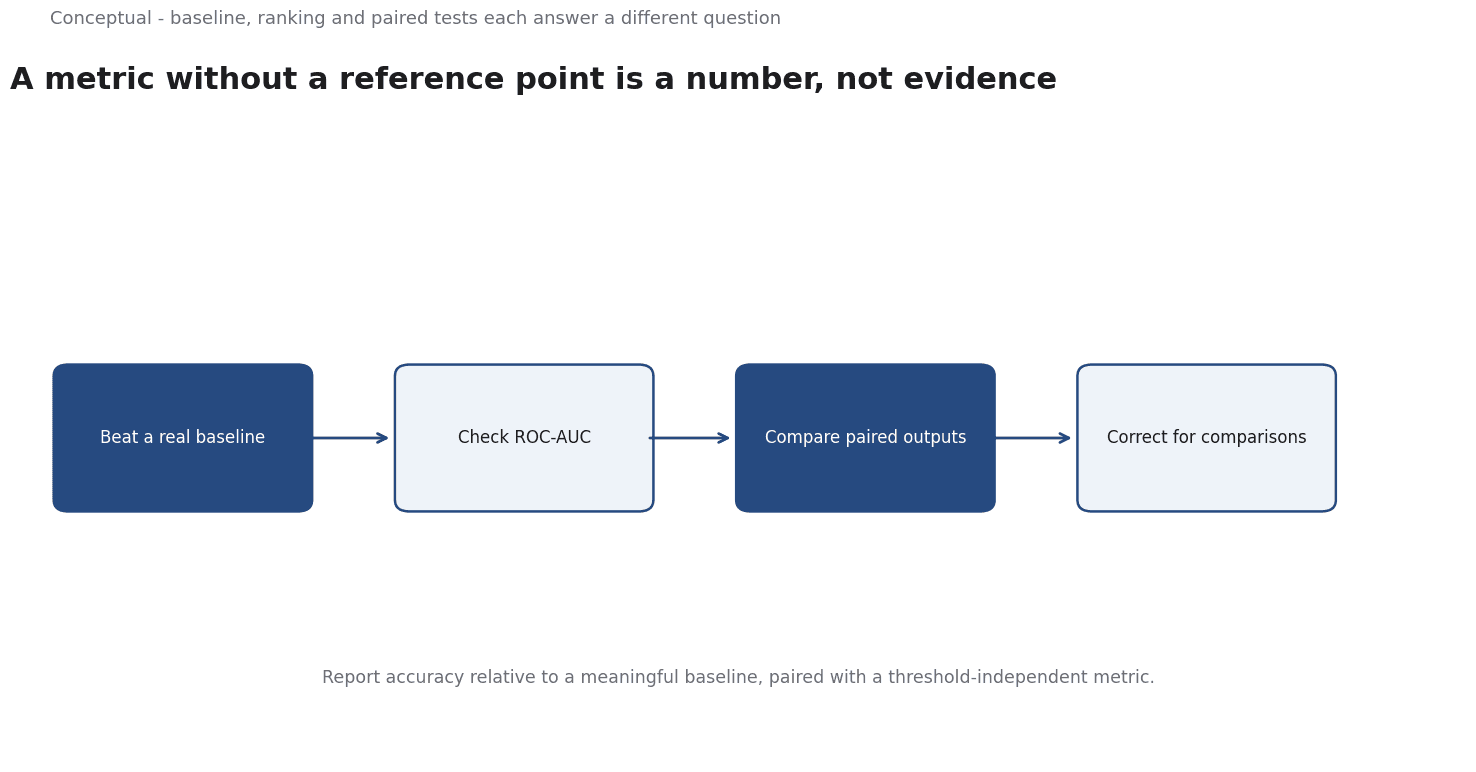
Direct answer: Report accuracy relative to a meaningful baseline, pair it with a threshold-independent metric such as ROC-AUC, compare models on the same predictions with paired tests, and correct for the number of comparisons you made. A metric without a reference point is a number, not evidence.
Accuracy is a rate, not a result
Accuracy answers one question: what fraction of labels did we get right? It does not say whether the task was hard, whether the classes were balanced, or whether a simpler rule would have done better. Two projects with the same accuracy can represent completely different achievements.
The practical consequence is that accuracy should never appear by itself. Put the baseline next to it, in the same table, with the same evaluation window. If the baseline is "always predict the majority class" and your model is only a few points ahead, the honest reading is that the model has not yet demonstrated value.
There is a second trap. Accuracy depends on the decision threshold. A model can have excellent ranking quality and poor accuracy at the default threshold. Choosing a threshold on the test set is a form of fitting, so thresholds belong in inner validation, not in the final report.
The baseline is the claim
A baseline is not a formality; it is the statement of what the model must beat to justify its existence. There are three levels:
- Majority or constant rule — the floor. Beating it proves the data contains some signal.
- Simple domain rule — a one-line calculation a human could do. Beating this proves the model found something beyond the obvious.
- Existing system — what the organisation does today. Beating this is what changes a decision.
Most reported "breakthroughs" clear level one and stop. In a forecasting problem where the outcome is already partly visible, the obvious rule can be stronger than a trained ensemble. If you do not test against it, you will mistake timing for skill.
ROC-AUC and what it adds
ROC-AUC asks a different question: if you draw one positive and one negative case at random, how often does the model rank the positive higher? Because it is computed across thresholds, it is not hostage to a single cutoff.
That independence is useful, but it is not a free pass. ROC-AUC can look strong while every calibrated probability is wrong, and it can be optimistic when the positive class is rare. It also says nothing about the economics of a decision — a false positive and a false negative rarely cost the same. Treat it as a companion to accuracy, not a replacement for an explicit decision rule.
Paired comparisons and the multiple-testing trap
Models evaluated on the same rows produce paired predictions. Comparing two accuracies as if they came from independent samples overstates uncertainty in the wrong direction. McNemar's test is designed for this: it looks only at the cases where the two models disagreed, which is exactly the information that matters.
Then comes the quieter problem. If you try twenty configurations and test each one, one will look significant by chance. Holm's step-down procedure adjusts the p-values so that the more comparisons you make, the stronger the evidence must be. An adjusted p-value of 1.0 should be read as "no evidence here", not "almost significant".
For the underlying logic of significance and its limits, see Confidence Intervals and p-values. A small sample makes this worse: with a few dozen evaluation periods, even a large-looking gap can be indistinguishable from noise.
Calibration is a separate question
A model can rank cases perfectly and still report probabilities that are too confident. Calibration asks whether a predicted 70% corresponds to an observed 70% across similar cases. It matters whenever a probability is consumed by a downstream decision, and it matters less when only the ordering is used.
This is why a probability bias chart can be more informative than an accuracy chart. If the model's stated confidence drifts systematically away from reality, the fix is calibration or abstention, not a larger model.
A decision test
Before publishing a classification result, ask:
- What is the baseline, and is it shown in the same table?
- Was the threshold chosen without touching the final holdout?
- Are the models being compared on identical rows, with a paired test?
- How many configurations were tried, and were the p-values corrected?
- Is the reported probability calibrated, or only ranked well?
If two of these are missing, the number is preliminary. For the data-side causes of an inflated score, read Data Leakage in Machine Learning.
References & Further Reading
- McNemar, Q. (1947). Note on the sampling error of the difference between correlated proportions or percentages. Psychometrika.
- Holm, S. (1979). A simple sequentially rejective multiple test procedure. Scandinavian Journal of Statistics.
- Confidence Intervals and p-values: What They Do and Do Not Support.