Compound Interest Costs Explained
Compound interest grows on both principal and past interest, but inflation erodes what that growth is worth. Read the two mechanisms, a worked example, and where it breaks.
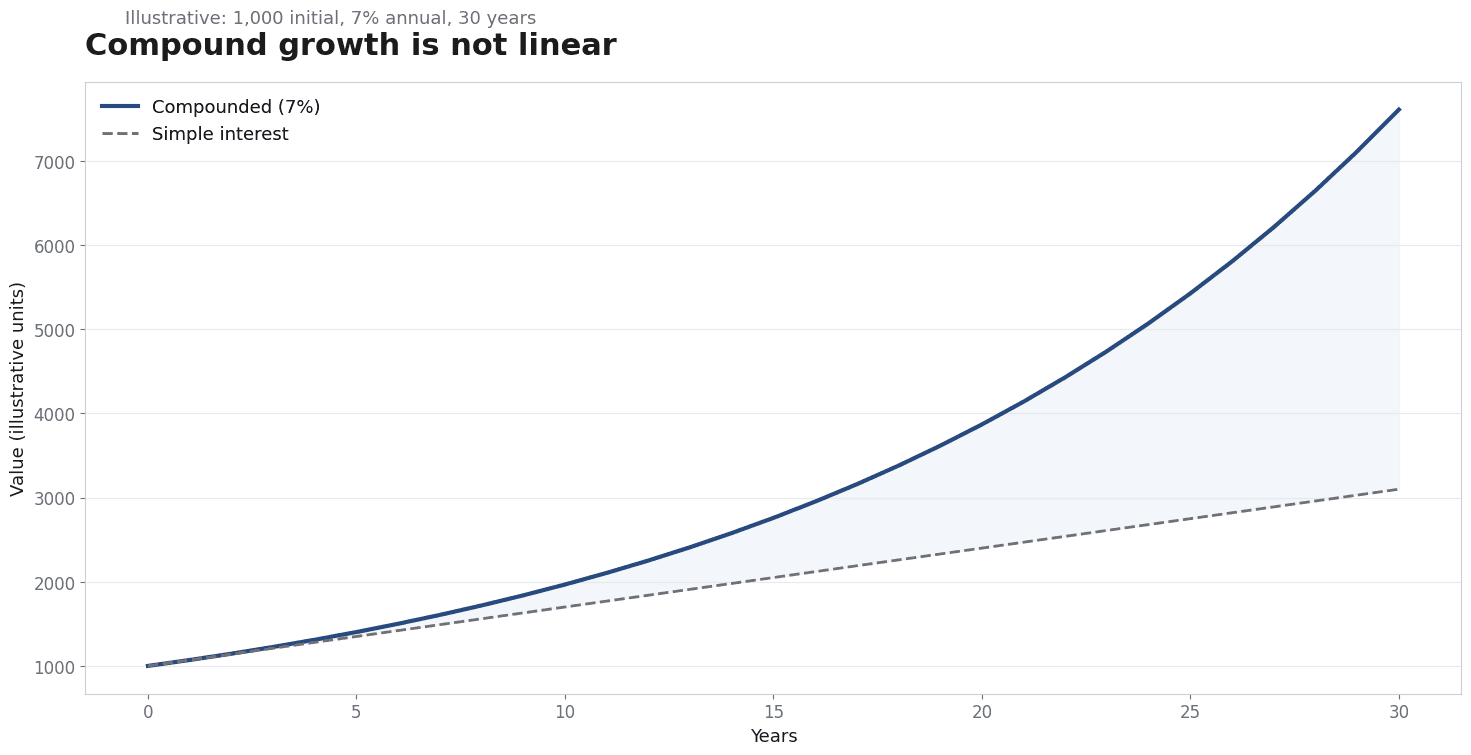
Compound interest is often presented as a number that grows on itself, and the figure can look impressive in isolation. The two sources describe how compounding works and what inflation does to purchasing power. The real problem is that a nominal compounding figure says nothing about the real value of the result, because prices can rise at the same time.
Direct answer: Compound interest adds earned interest to the principal so later periods earn on a larger base, while inflation reduces what a given sum can buy over time. The sources define both mechanisms; reading the nominal result against an inflation rate is a synthesis. The nominal figure alone is not a measure of real gain.
Delta: This article adds a claim-status table and a nominal-to-real reading decision test beyond the sources: it maps a compounding figure to a purchasing-power decision, with claim status explicit.
The mechanism
The Wikipedia entry on compound interest describes interest calculated on the initial principal and on the accumulated interest from prior periods. Where simple interest earns only on the original amount, compounding earns on a base that keeps expanding. The practical consequence is that growth accelerates: each period's interest is added to the principal, so the next period is measured against a larger sum. How quickly that happens depends on how often interest is added to the base, which is why the same stated rate can produce different results under different compounding frequencies.
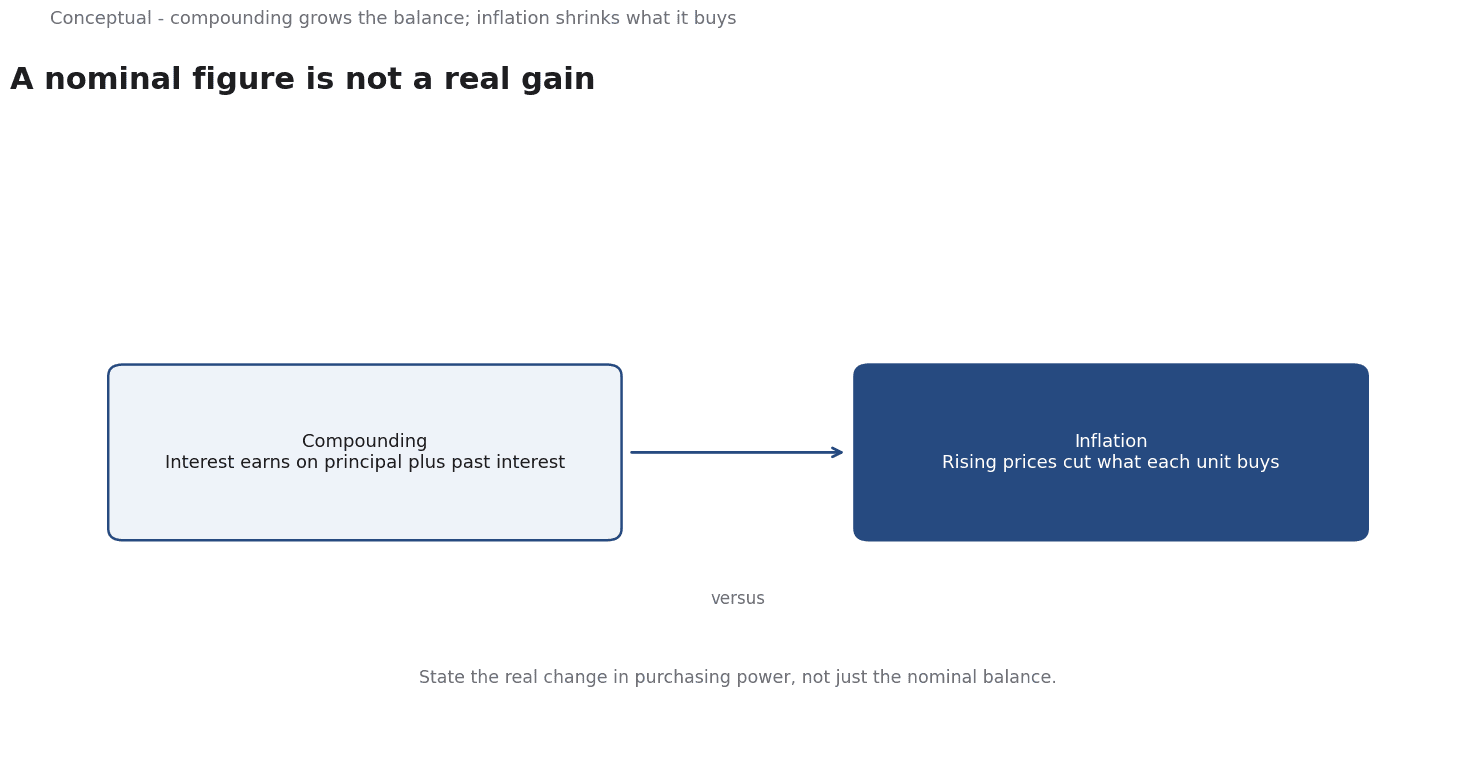
The inflation entry describes a general rise in prices and the resulting fall in the purchasing power of money. When the price level rises, a given number of currency units buys fewer goods and services. The practical consequence is that a sum which grows in nominal terms can buy less than it did before if the price level rises faster than the sum grows. A number that looks larger on paper can represent a smaller claim on real resources, and that gap is easy to miss when only the nominal figure is shown.
The two mechanisms operate on different quantities.
Compounding changes the number of currency units in a balance; inflation changes what each unit buys. A figure that is correct under the first description can mislead under the second. The sources treat each mechanism separately, so the habit of reading them together is an inference about how to interpret a result, not a definition either source supplies. The point is not that one cancels the other, but that a real change in purchasing power depends on both.
The output of a careful reading is a discipline: state the nominal result, identify the relevant inflation rate, and describe the real change in purchasing power. The sequence is to define the compounding base, compute the nominal figure, bring in the price change, and then bound the claim that the number supports. Neither source supplies a particular rate, balance, or time horizon, so the specific inputs are always local choices that should be marked as inferred.
A worked example
The following is hypothetical and illustrative. A saver reviews a balance that has grown under compound interest and wants to know what it is worth. Three checks decide the reading. First, is the growth calculated on the original principal plus accumulated interest, and how often is interest added to the base? Second, has the general price level changed over the same period, and by how much? Third, after accounting for that price change, does the balance buy more, less, or the same as it did at the start? The review finds that the nominal balance rose while prices rose faster, so purchasing power fell despite the larger number. The outcome is a real-value reading, not a claim that compounding failed. The figures are hypothetical; the verification method is the contribution.
Evidence status
| Claim | Status | Source | Verified | Recheck when |
|---|---|---|---|---|
| Compound interest earns on principal and past interest | source-reported | Wikipedia, Compound interest | 2026-11-18 | Definition revised |
| Inflation reduces the purchasing power of money | source-reported | Wikipedia, Inflation | 2026-11-18 | Definition revised |
| A nominal compounding figure can mislead without inflation | inferred | Derived from the sources | 2026-11-18 | Inflation outlook changes |
The first two rows are factual claims drawn from the sources. The third is an inference about interpretation, because neither source says that a nominal figure misleads on its own. Recheck the definitions when the source entries change, and the inferred claim when the inflation outlook or the relevant price measure changes.
What it cannot do
A compound interest figure does not measure real gain. It counts currency units, not purchasing power. A balance can grow substantially in nominal terms and still represent a smaller claim on goods and services if prices have risen faster. The compound interest entry describes how the balance grows; the inflation entry describes why that balance may buy less. Neither makes the comparison on its own, so a reader who quotes the nominal number as if it settles the question of gain is using the figure for something it was not defined to do.
The hidden cost is that the real comparison needs an extra input that is not handed over with the nominal figure. To say whether purchasing power changed, a reader must choose a price measure and a time period that match the compounding period. That choice is not neutral: different measures and periods can give different answers. The work of selecting and defending the price input is the cost that a headline compounding number quietly avoids, and it is why a clean nominal figure is easier to publish than a qualified real one.
The same stated rate produces different nominal results depending on how often interest is added to the principal, so a figure computed under one frequency is not interchangeable with one computed under another. A quoted number that omits its compounding frequency cannot be checked, and a comparison between two such numbers may be meaningless. When inflation is layered on top, the error compounds: a small mistake in the nominal base is carried into the real-value reading as if it were precise.
There is a boundary around what these sources establish. The compound interest entry defines how interest accumulates; the inflation entry defines a general rise in prices and the fall in purchasing power. Neither offers a forecast, a model of future rates, or a rule for choosing a price index. Those judgments lie outside the two documents and need separate evidence. A reader expecting a prediction of future balances or future prices will not find one here, and should not mistake a definition of the mechanisms for a projection about any particular saver.
Because prices and rates change, the reading needs review whenever either input shifts. Each real-value claim should carry the price measure it used and a recheck condition, and the compounding frequency should be stated alongside the nominal figure. Without that record, a later reader cannot tell which assumptions produced the number, and a small change in the price measure can turn an apparent gain into a loss without anyone noticing the switch.
The counterargument that a nominal compounding figure is fair for describing balance growth is incomplete when it is read as a statement about purchasing power.
A decision test
- State the principal and the stated interest rate.
- Record how often interest is added to the principal.
- Compute the nominal balance for the chosen period.
- Select a price measure that matches that period.
- Compare the price change with the nominal growth.
- State the real change in purchasing power, not just the nominal one.
- Record the assumptions with a recheck date tied to the price measure.
The test keeps the nominal figure and the real interpretation distinct. By making the compounding frequency and the price measure explicit, a reviewer can say exactly what the number shows and what it does not, instead of letting a large nominal balance stand in for a claim about what it buys. For further reading, see Cash Flow Forecasting: A 13-Week Operating Model.
References & Further Reading
- Wikipedia contributors, 2026. Compound interest - Wikipedia — Interest calculated on principal plus prior interest.
- Wikipedia contributors, 2026. Inflation - Wikipedia — The definition of inflation, its measurement and its effect on nominal versus real quantities; secondary reference.