Correlation vs Causation: The Most Common Mistake in Data Analysis
Two variables moving together does not mean one causes the other. Learn how to tell correlation from causation and avoid bad decisions.
Dashboards are full of correlations. Two lines move together, and someone concludes one causes the other. That conclusion is often wrong.
Direct answer: Correlation means two variables move together; causation means one variable directly produces a change in another. Correlation does not imply causation, and treating it as if it did is one of the most common and costly mistakes in data analysis. Establishing causation requires more than a shared trend—it requires ruling out confounders, reverse causation, and coincidence.
What correlation actually measures
A correlation coefficient tells you the strength and direction of a linear relationship between two variables.
It says nothing about mechanism, direction, or whether a third factor drives both.
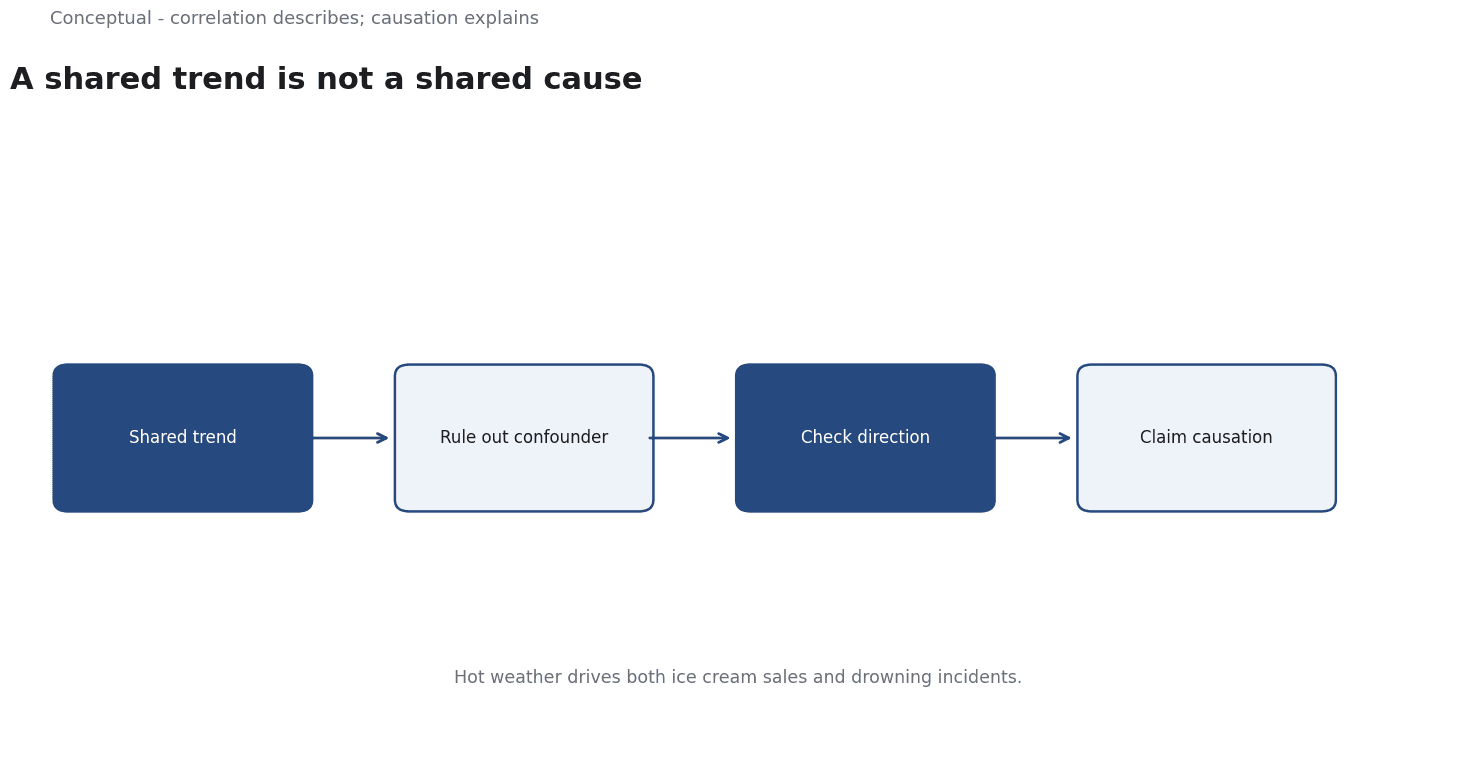
Ice cream sales and drowning incidents both rise in summer. The correlation is positive and strong. But ice cream does not cause drowning, and drowning does not cause ice cream sales. Hot weather causes both: more people eat ice cream and more people swim. Temperature is the confounder—the third variable that creates the illusion of a direct link.
This is the central trap. A strong correlation can exist because:
- A confounder causes both. (Weather causes ice cream and swimming.)
- Reverse causation. (B causes A, not A causes B.)
- Pure coincidence. (Two trends happen to align over a limited period.)
- A mediator chain. (A causes C, C causes B, so A and B correlate even though A never touches B directly.)
Why this mistake is expensive
Businesses act on correlations all the time. Examples:
- A retail chain notices stores with more staff also have higher sales, and hires more staff everywhere. Causality may run the other way: busier stores get more staff, not the reverse.
- A SaaS company sees users who invite teammates churn less, and concludes referral programs reduce churn. It may be that engaged users both invite teammates and stay, with no causal link from inviting to retention.
- A manufacturer finds machines operated by senior technicians fail less often, and concludes seniority prevents failure. It may be that senior technicians are assigned to newer, more reliable machines.
How to test for causation
There is no single test, but several approaches strengthen causal claims:
1. Randomized controlled experiments. Randomly assign treatment and control groups. If the treated group improves and the control does not, and everything else is balanced, you have strong evidence of causation. This is the gold standard but not always feasible.
2. Natural experiments. Look for situations where the world assigns treatment as-if-random—a policy change in one region, a sudden outage affecting some users but not others. These mimic randomization.
3. Control for confounders. Measure and statistically adjust for variables that might cause both A and B. This helps, but you can only control for confounders you know about and can measure.
4. Temporal precedence. The cause must precede the effect. If B changes before A, A cannot cause B.
5. Dose-response. If more of A produces more of B, the relationship looks more causal. But dose-response can also arise from confounders.
6. Falsification tests. Check whether the correlation appears where it should not. If "ice cream causes drowning," it should not appear in winter. If it does, the theory is wrong.
What to do when you cannot run an experiment
Most business data is observational. You cannot randomize pricing, store locations, or marketing channels at will. In that case:
- State the limitation. Say "associated with" rather than "caused by."
- Look for contradictory evidence. Actively try to disprove your favorite theory.
- Use multiple data sources. A correlation that holds across datasets, regions, and time periods is more credible than one that appears in a single report.
- Think about mechanisms. Can you explain how A would produce B? If no plausible mechanism exists, treat the correlation with skepticism.
For a concrete example of how pooling data can reverse relationships, see Simpson's Paradox in Your Own Data.
Seeing is not doing
The references for this article point to a distinction that resolves much of the confusion: correlation answers a question about what is observed, while causation answers a question about what would happen if we intervened. Peters, Janzing, and Scholkopf formalize this with graphical causal models and the do-calculus, a set of rules for reasoning about interventions rather than passive observations. The notation matters because it prevents a subtle slide: seeing that B happens when A happens is not the same as asking what happens to B if we set A ourselves.
This explains why the confounder examples above are so stubborn. In an observational dataset, a common cause such as the weather is present in the record, but nothing in a simple correlation tells you which arrows to draw between variables. A causal graph forces the analyst to state the assumed structure: what causes what, and where the common causes sit. Once the graph is written down, the incompatibility of a causal claim with the data can become visible in a way that a coefficient never reveals.
The practical value is not the formalism but the discipline. Drawing a graph asks the analyst to commit to a mechanism and to name variables that may be unmeasured. That is harder than reporting a correlation, which is precisely why it catches errors. A relationship that survives an honest graph and an identification argument deserves more trust than one that merely appears in a dashboard.
A worked example
The following is hypothetical and illustrative. Suppose an analyst at a subscription company observes that customers who use a certain feature renew at higher rates and proposes mandating it for everyone. The correlation is real, but the earlier section on reverse causation and confounders applies: engaged customers may simply be more likely to both discover the feature and renew.
Hernan and Robins offer a design discipline for exactly this situation. Target trial emulation asks the analyst to specify the trial they would have run if they could: who would be eligible, what the treatment and comparator would be, when follow-up starts, and what outcome matters. Writing that protocol before touching the observational data makes the design choices explicit and prevents the analysis from being shaped by the result.
The analyst then uses the observational data to approximate that trial, applying methods suited to confounding rather than a naive comparison. The result is still weaker than a randomized experiment, and the honest report says so. What changes is the quality of the question: instead of asking whether the feature correlates with renewal, the team asks whether prompting it would increase renewal for a comparable customer who would not otherwise use it. That is a causal question, and it is the one the decision actually depends on.
A counterargument
A reasonable critic would note that the causal framework recommended here trades one hidden assumption for another. Peters, Janzing, and Scholkopf are explicit that a graph is not inferred from observational data alone: several graphs encode the same distribution, so the committed arrows are assumptions the data cannot verify.
Writing a graph is discipline, but it can also manufacture confidence, since a wrong graph is no more falsifiable than the coefficient it replaced.
Hernan and Robins' target trial emulation sharpens the question yet still depends on the confounders the record contains, so an unmeasured common cause survives the exercise. The framing is strong when assumptions are stated and defended; incomplete when a conditional conclusion is presented as settled fact.
References & Further Reading
- Jonas Peters, Janzing, and Schölkopf, 2017. Elements of Causal Inference — A textbook treatment of graphical causal models, identification, and the do-calculus.
- Miguel A. Hernán and James M. Robins, 2020. Causal Inference: What If — Hernan and Robins on target trial emulation, g-methods, and the design of observational studies.