Distributed Tracing in Practice
A trace follows one request across services. Read what a span contains, a worked investigation, and why sampling can hide the failure.
A log tells you what one component did; a trace tells you what happened to one request as it moved through the system. In a microservices architecture, that difference is decisive: a slow response may be fast in every service but slow in the waits between them. Tracing is the instrument that reveals those gaps.
Direct answer: A distributed trace is a tree of spans, each representing a unit of work with a parent, timing, attributes, and a shared trace context propagated across service boundaries. OpenTelemetry's tracing documentation is the primary source for the model, and the specification defines how context is propagated. The boundary: a trace is useful only if the services participate and the sampling strategy retains the requests you need to investigate, as Observability: Logging, Metrics, Tracing, Alerting argues for signals that support a decision.
The sampling decision
Tracing every request in a high-volume system is expensive, which is why nearly every implementation samples. Head-based sampling decides at the start of a request, which is cheap and simple but cannot know that a request will later fail or become slow, as the tracing documentation explains.
A failure that occurs deep in a call chain can therefore be invisible because the request was not selected at the edge, which is the exact event most worth retaining.
Tail-based sampling waits until the trace is complete and then decides whether to keep it, which allows a policy that retains errors and slow traces, as the OpenTelemetry guidance recommends. The cost is that all spans must be held briefly and the decision logic must be operated, which the cloud-cost article treats as a workload with its own expense. For most teams, a hybrid is practical: a low baseline rate with a rule that always keeps failures and high-latency traces, which the observability article argues for signals that support an investigation.
Sampling should be reviewed after an incident.
A dated record of that review, with the change made, is the discipline the decision-memo article recommends for consequential choices.
What a span contains
A parent and a trace ID. These connect the span to the request, which is how a system reconstructs a path across services, as the tracing documentation explains for context propagation.
Timing. Start and duration, which show where time was spent. The gap between a child span ending and its parent continuing is often the signal of queuing or a slow dependency, which the batching-economics article treats as waiting time that local speed cannot remove.
Attributes and events. A name, a status, and key fields such as an operation or error code. These should be useful for diagnosis without embedding sensitive data, as the data-governance article requires for relied-upon records.
Three consequences follow. Instrumentation must cover the boundaries between services, not only their internals, which the microservices article treats as where failures appear. Context must propagate through queues and async calls, which the message-queue article explains for decoupled work. And the volume of spans makes sampling necessary, which is where many implementations lose the events they most need.
A worked investigation
The following is hypothetical and illustrative. A checkout request takes 4 seconds in a system whose services each log sub-200 millisecond operations.
The trace shows the API gateway span lasting 4 seconds, with a child call to the payment service that starts after a 2-second gap. The payment service span itself is 150 milliseconds. Three checks decide the cause. First, is the gap between spans a queue or a network delay, as the tracing documentation recommends reading timing across the tree? Second, does the same gap appear in other traces, which the observability article treats as a pattern worth an alert? Third, is the affected request retained by sampling, as the tracing guidance warns that head-based sampling can drop the slow tail?
Three conclusions follow.
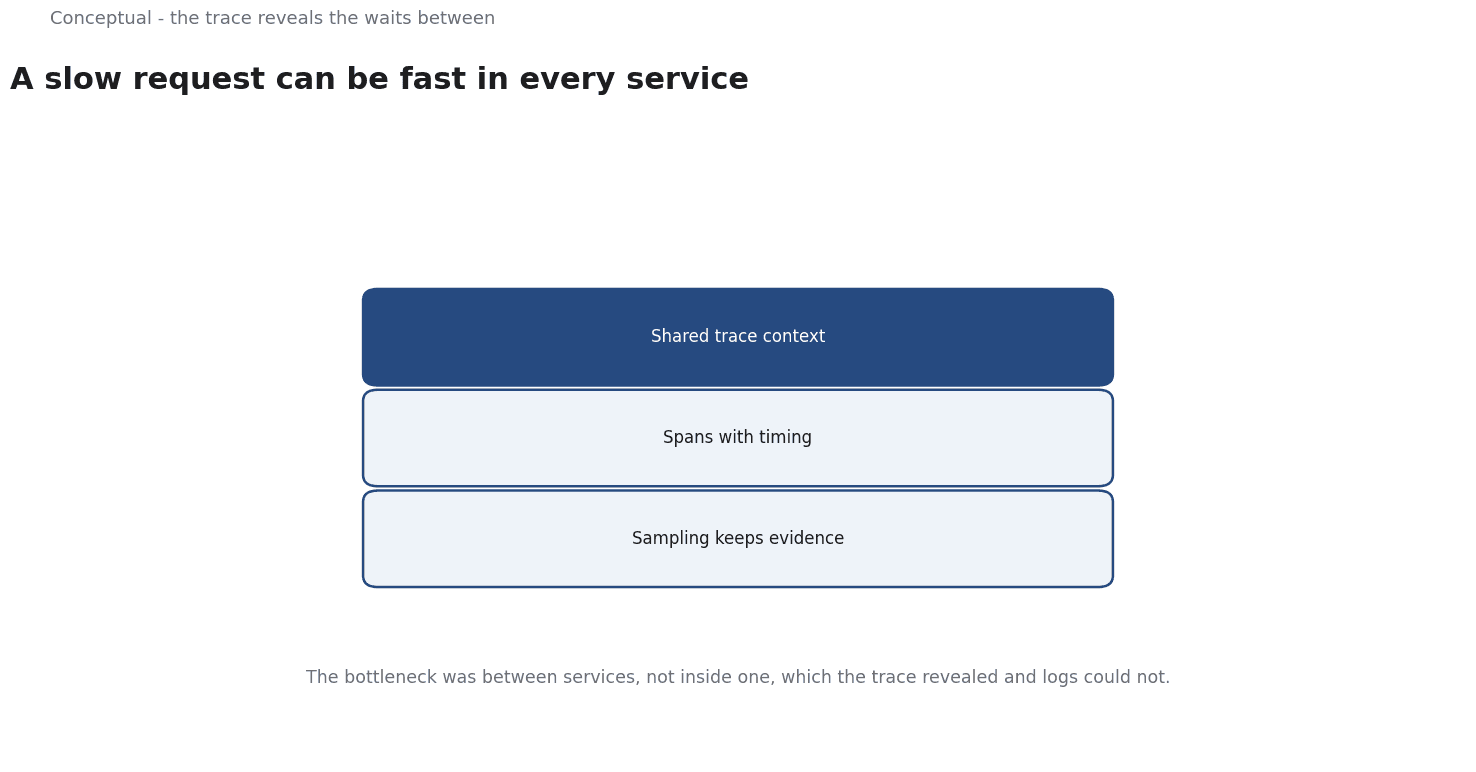
The bottleneck was between services, not inside one, which the trace revealed and logs could not.
A targeted alert on the gap is more useful than a generic latency threshold, as the SLO article argues for symptoms that matter. And sampling should be reviewed to retain slow requests, as the tracing documentation advises for error-heavy and latency-heavy paths.
What tracing cannot do
It cannot explain business causes; it shows where time went, not why a dependency was slow, which the causal-inference article treats as a separate question. It cannot replace metrics and logs, which the observability article treats as complementary signals. And it cannot work if services do not propagate context, which the specification makes a shared responsibility.
The counterargument that tracing is too heavy for a small system is fair. The response is proportionality: instrument the boundaries that matter, which the microservices article recommends for distributed failure modes, and expand when the system grows.
A decision test
- Instrument service boundaries, not only internals.
- Propagate context across synchronous and async calls, as the tracing documentation requires.
- Keep attributes useful and free of sensitive data, as the data-governance article advises.
- Read the gaps between spans, as the worked investigation shows.
- Review sampling to retain slow and failed requests, as the tracing guidance recommends.
- Alert on a pattern in the gaps, as Observability: Logging, Metrics, Tracing, Alerting advises.
- Review instrumentation after architecture changes, as the monitoring article requires.
For the broader practice, see Observability; for the async boundary, see Message Queues Explained.
References & Further Reading
- OpenTelemetry, 2026. Traces | OpenTelemetry — Primary documentation on distributed traces, spans and context propagation.
- OpenTelemetry, 2026. OpenTelemetry Specification — The normative specification behind the SDKs.