EBITDA Quality without the Hype
EBITDA removes charges, not economics. Read what it measures, a worked comparison, and why a clean figure can hide real cost.
EBITDA is often presented as a cleaner version of profit, which hides the fact that the excluded charges are real costs. The Wikipedia entry defines the measure, and the income-statement entry structures the figures it draws from. Quality means knowing what was removed and why.
Direct answer:
Read EBITDA beside cash flow and the charges it excludes, with the accounting basis stated.
The sources define the measure; the quality rule is a synthesis.
Delta: This article adds a claim-status table and a worked reconciliation, separating the documented definition from the local judgement about which adjustments matter.
The mechanism
Three points matter:
- The exclusions are named. The Wikipedia entry defines earnings before interest, taxes, depreciation and amortisation. Each exclusion corresponds to a real economic item.
- Capital intensity changes the meaning. A business with heavy assets has significant depreciation. Removing it makes two businesses look more alike than they are.
- Cash is the check. The income-statement entry structures reported figures, but cash flow shows what was actually spent. The reconciliation is where quality becomes visible.
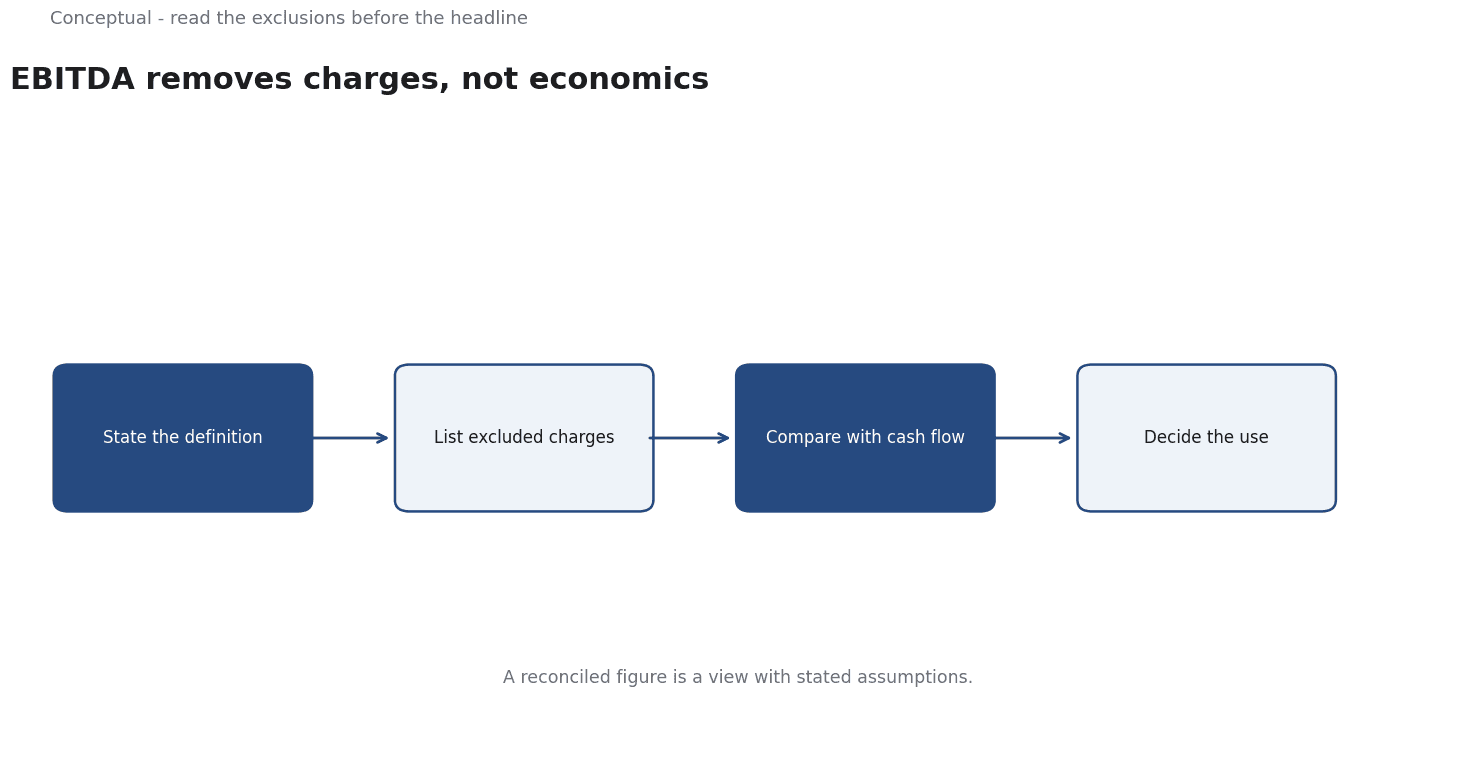
The sequence is: state the definition, list the excluded items, compare with cash flow, then decide what the figure can be used for. The decision is judgement, so it is inferred; the definition is source-reported.
A worked comparison
Illustrative. Two companies report the same EBITDA, but one owns its assets and the other leases them.
Three checks decide. First, which charges were excluded, and do the two companies treat leases and depreciation the same way? Second, does operating cash flow support the reported figure, or is the difference tied to working capital? Third, what happens to the comparison if maintenance capital expenditure is considered?
The outcome is a qualified view, not a ranking by EBITDA. The numbers are hypothetical; the reconciliation is the contribution.
Why the exclusions matter more than the total
A measure that removes depreciation, interest, and tax is answering a specific question: how much operating income the business generated before financing and accounting choices. That question is useful when comparing operating performance across companies with different debt levels. It is much less useful when the excluded items are large and recurring.
The test is whether the exclusions behave like one-offs. A company that reports restructuring costs every year is describing a recurring activity. A company with substantial depreciation is describing assets that wear out and must eventually be replaced. In both cases the excluded figure belongs in a careful reading, even if the standard definition permits removing it.
What a reconciliation shows
A reconciliation starts from the reported figure and adds back the items that matter for the decision at hand. It does not claim that the original figure is wrong; it makes the adjustments visible so a reader can disagree with them. That is the difference between a metric presented as fact and a metric presented as a view with stated assumptions.
Evidence status
| Claim | Status | Source | Verified | Recheck when |
|---|---|---|---|---|
| EBITDA excludes interest, tax, depreciation and amortisation | source-reported | Wikipedia, EBITDA | 2026-11-18 | Definition revised |
| Income statements structure reported figures | source-reported | Wikipedia, Income statement | 2026-11-18 | Standards change |
| Read EBITDA beside cash flow and exclusions | inferred | Derived from the definition | 2026-11-18 | Business model changes |
Why adjustments need a rationale
An adjusted figure is useful only when the adjustment is explained. A company that removes restructuring costs every year is not showing a one-off; it is showing a recurring cost under a different name. Reading the adjustments across several periods is the simplest way to tell.
Interest is excluded by definition, which makes EBITDA comparable across different levels of debt. That is useful for some purposes and misleading for others, because debt must still be serviced. Stating the purpose of the comparison decides whether the exclusion helps.
The measure also invites a comparison problem. Companies in different industries have different capital intensity, which makes the same EBITDA figure describe very different underlying economics. A software business and a manufacturer can report similar earnings before depreciation while requiring very different ongoing investment to sustain them. Stating the industry context is therefore part of a defensible reading, not a decorative detail. When the context is omitted, the comparison measures accounting policy more than performance, and the conclusion invites a decision that the figure cannot support.
What it cannot do
It cannot measure cash generation. It does not remove the need to understand the business. And it cannot guarantee comparability when accounting policies differ.
The counterargument that EBITDA is easier to compare is fair for a first screen and incomplete for an investment decision.
A decision test
- State the definition used.
- List the excluded charges.
- Compare with operating cash flow.
- Check lease and depreciation treatment.
- Read adjustments across periods.
- Use dated figures.
- Record the assessment and its limits.
For the measure, see EBITDA Explained.
References & Further Reading
- Wikipedia contributors, 2026. Earnings before interest, taxes, depreciation and amortization - Wikipedia — A measure of earnings before interest, taxes and depreciation.
- Wikipedia contributors, 2026. Income statement - Wikipedia — The structure of revenue, expenses and profit, and the difference between revenue and cash.