Engagement Loops without the Hype
Engagement loops demystified through viral-marketing mechanics and web-analytics measurement, separating claims from decisions with explicit claim status.
Engagement loops are often described as self-running growth engines, but the practical problem is measuring whether a loop actually repeats. Teams celebrate shares without tracking conversion, and attribution gets credited to the last click. This article uses viral-marketing mechanics and web analytics to separate the loop's claims from the decisions it can support.
Direct answer: A growth loop repeats when a user's action brings in new users who repeat the action, and its strength depends on both how many invites convert and how fast the cycle turns. The sources describe viral marketing as network-based, self-replicating promotion and web analytics as measurement of traffic and behavior.
The bounded answer is to instrument each step of the loop and treat improvement as a hypothesis to be tested, not a property of the design.
Delta: This article adds a decision mapping beyond the sources: it maps viral-loop mechanics and analytics instrumentation to testable growth decisions, with claim status explicit.
The mechanism
Viral marketing is described as promotion that relies on social networks and word of mouth, where participants spread awareness to others. The mechanism is self-replication: each participant can recruit further participants. The practical consequence is that the unit of analysis is a cycle, not a single acquisition, so a team should map the steps from user action to new user activation before discussing growth at all.
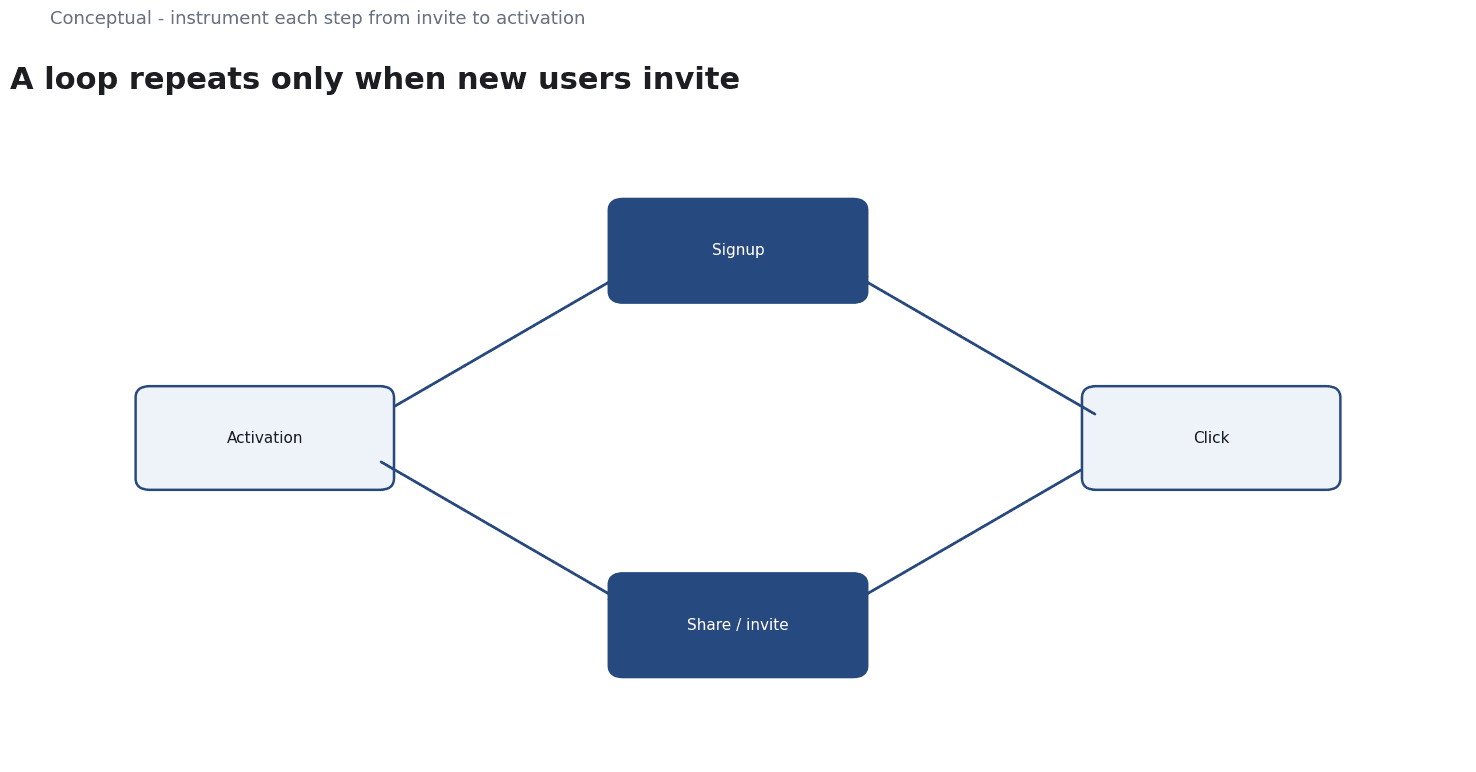
Web analytics covers the collection and analysis of web data such as traffic, sessions, page views, and conversion events. It provides the instrumentation to observe each step of the loop. The practical consequence is that without event tracking at the share, click, signup, and activation stages, the loop is an assumption rather than a measurement, and the weakest step cannot be identified or prioritized.
The loop's arithmetic links the two concepts. Growth depends on the number of invitations sent, the fraction that convert, and the cycle time, which is how long a new user takes to start inviting others. Analytics supplies estimates for each term. The practical consequence is that two loops with identical share counts can grow at very different rates if their conversion or cycle time differs, so raw sharing volume is a poor proxy for loop strength.
Best practice therefore becomes measurement discipline: instrument the steps, estimate the coefficient and cycle time, find the weakest link, and run a controlled test before changing the product. The sources justify the mechanism and the measurement category; the thresholds and the experiment design come from the team. Claim status matters because the arithmetic is an inference layered on descriptive sources, not a law the sources assert.
A worked example
The following is hypothetical and illustrative. An app team believed its referral loop was driving growth. Three checks were run. First, each step was instrumented from invite sent to invitee activation, revealing that most shares never produced a click. Second, the viral coefficient was estimated from conversion at each step and was well below one, meaning the loop was not self-sustaining. Third, a holdout group was withheld from the referral prompt to test causality. The outcome was that referrals added some users but were not the growth engine assumed. This scenario is illustrative, not a measured case.
Evidence status
| Claim | Status | Source | Verified | Recheck when |
|---|---|---|---|---|
| Viral marketing relies on social networks and self-replicating sharing to grow awareness | source-reported | Viral marketing Wikipedia | 2026-11-18 | When platform sharing mechanics change |
| Web analytics measures and reports web traffic and user behavior metrics | source-reported | Web analytics Wikipedia | 2026-11-18 | When measurement standards change |
| Loop growth depends on both the viral coefficient and cycle time, so step-level instrumentation determines which interventions are testable | inferred | Derived from the sources | 2026-11-18 | When controlled experiment data exists |
The source-reported rows restate what the references define. The inferred row is the bridge this article adds from a loop description to a testable decision, and it is contingent on instrumentation the team must build. Recheck conditions mark the specific developments that would change each claim's usefulness rather than expire on a schedule.
What it cannot do
The viral-marketing source is descriptive rather than a quantified model, and simple coefficient arithmetic omits saturation, overlapping networks, and users who invite no one. Real loops rarely sustain themselves indefinitely, so extrapolating a coefficient into a long-range forecast is unsafe. The mechanism explains how sharing can propagate; it does not promise that a designed incentive will produce propagation.
Instrumenting every step takes engineering effort, and analytics data has limits. Attribution often favors the last touch, cookie and privacy restrictions reduce visibility, and event definitions can change silently, breaking comparisons over time. A dashboard can therefore look authoritative while the underlying series are not comparable, which is exactly the situation in which a loop is most likely to be over-credited.
Users who share may simply be the most engaged users, so a loop can look effective without causing growth. Survivorship bias amplifies this, since failed loops are rarely written about and successful ones are narrated after the fact. Without a holdout or a randomized prompt test, there is no basis for claiming that sharing produced the acquisitions it precedes.
The sources are generic and do not prescribe experiment designs, sample sizes, or how to value a referral. Different products and cultures share differently, so a coefficient measured in one context is not portable to another. A loop that works for a collaboration tool may fail for a passive consumer app, and the descriptive material offers no adjustment rule for that difference.
Platform changes, privacy rules, and user behavior shift loop parameters over time. The instrumentation and the causal tests need scheduled review, and a loop that stops repeating should be retired rather than defended with historical numbers. Ownership for the event definitions and the holdout tests should be explicit so this review actually happens.
The counterargument that a well-designed loop is fair as a growth heuristic is reasonable, but incomplete for investment decisions: a heuristic cannot tell you whether sharing caused growth or merely accompanied it.
A decision test
- Map the steps from user action to new user activation.
- Instrument each step with a consistent event definition.
- Estimate conversion at each step and compute the coefficient.
- Measure the cycle time from signup to first invite.
- Identify the weakest step by comparing step-level conversion.
- Run a holdout test before changing the product.
- Label loop claims as measured or inferred before forecasting.
These steps replace hype with a measurable routine. The goal is not to prove that a loop is viral but to find which step, if improved, would change growth and by how much. When a holdout shows no effect, treat the loop as correlation and reallocate the experiment. For further reading, see Marketing Dashboards without the Hype.
References & Further Reading
- Wikipedia contributors, 2026. Viral marketing - Wikipedia — Growth driven by word of mouth and referral loops.
- Wikipedia contributors, 2026. Web analytics - Wikipedia — Collection and interpretation of website behaviour data.