Food and Beverage Metrics that Matter
Food and beverage operations live on thin margins and short shelves. Read the metrics, a worked example, and why a sales figure hides spoilage.
A food and beverage business has a constraint that many others do not: the product expires. A sales figure can look healthy while waste, spoilage, and stockouts quietly consume the margin, as the food-industry entry describes production and distribution, as the FDA recalls material treats safety as a primary obligation, as the inventory article treats stock as a cash decision.
Direct answer: Track the metrics that connect purchasing, yield, waste, and safety to cash — gross margin per item, spoilage, stockout rate, and compliance. The food-industry entry provides the context, and FDA recalls cover the safety boundary. The boundary: this is educational orientation, not operational or legal advice — rules and products differ by jurisdiction, as the legal and tax articles require a dated check, as the publication standard forbids guaranteed outcomes.
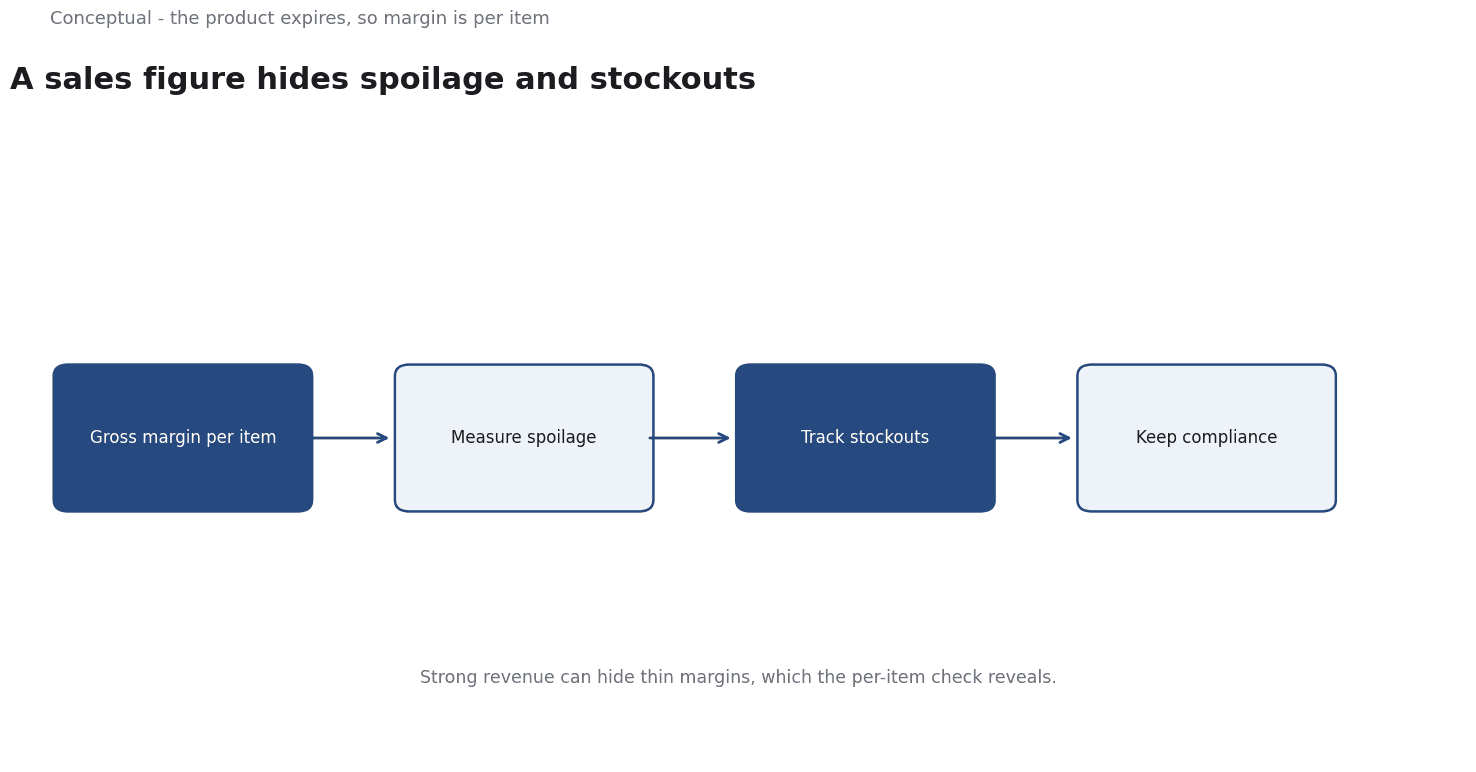
The metrics
Gross margin per item. Revenue minus the cost of the inputs actually used, which the unit-economics article requires for contribution, as the profitability article explains for accounting layers, as the pricing article treats margin as a constraint.
Yield and spoilage. How much of what was purchased becomes something sellable, which the operations literature treats as the core of food cost, as the inventory article treats stock as cash, as the cash-flow article requires for the cash actually received.
Stockout rate. A lost sale from an empty shelf, which the supply-chain article treats as a service-level question, as the demand-forecasting article advises for metric choice, as the menu-engineering literature treats availability as revenue.
Safety and compliance. Recalls and safety alerts are a boundary, not a metric to optimise, which the FDA recalls material treats as primary, as AI Risk Assessment: A Pre-Deployment Checklist requires residual risk, as the crisis article treats a recall as reputation recovery.
Three consequences follow. The figures need consistent definitions and dates, which the data-governance article requires, as the comparables article requires for consistency.
And the result should be reviewed, as the monitoring article treats as a trigger.
A worked example
The following is hypothetical and illustrative. A café reports strong revenue but thin profit.
Three checks decide where to look. First, what is the gross margin per item after the actual inputs used, as the unit-economics and profitability articles require, rather than after the invoice price, as the cash-flow article advises? Second, how much spoilages and trim is discarded, as the operations and inventory articles advise, with a measured figure, as the rubric article requires? Third, how often is a popular item unavailable, as the supply-chain and demand-forecasting articles advise, and is there any compliance issue, which the FDA material treats as a boundary, as AI Risk Assessment: A Pre-Deployment Checklist requires?
Three conclusions follow.
Strong revenue can hide thin margins, which the per-item check reveals.
Spoilage is a real cost, as the inventory and operations articles advise, as the cash-flow article requires. And the result should be recorded, as the decision-memo article requires, as the monitoring article advises for review.
What these metrics cannot do
They cannot guarantee profitability, which the publication standard forbids claiming, as the unit-economics article requires for contribution. They do not replace safety compliance, which the FDA material treats as a boundary, as AI Risk Assessment: A Pre-Deployment Checklist requires residual risk. And they cannot remove demand uncertainty, which the demand-forecasting article treats as a metric choice, as the scenario-analysis article requires conditional thinking.
The counterargument that revenue is the simplest signal is fair for a quick view and incomplete where margin and waste decide the outcome, which the worked example shows, as the profitability and inventory articles advise.
A decision test
- Compute gross margin per item from actual inputs, as the unit-economics article requires.
- Measure yield and spoilage, as the operations and inventory articles advise.
- Track stockout rate, as the supply-chain article advises.
- Treat safety as a boundary, as the FDA recalls material requires.
- Use consistent definitions and dates, as data governance requires.
- Review after a menu or supplier change, as the monitoring article advises.
- Record the decision, as the decision-memo article requires.
For the channel, see Retail Channels; for the risk boundary, see Risk Assessment.
References & Further Reading
- Wikipedia contributors, 2026. Food industry - Wikipedia — The structure of food and beverage production and distribution.
- U.S. Food and Drug Administration, 2026. Recalls, Market Withdrawals, & Safety Alerts — The public record of product recalls, market withdrawals and safety alerts, and the entry point to FDA recall guidance.