How to Evaluate Observability
Observability is more than collecting telemetry. Read how traces connect signals to questions, a worked evaluation, and where an observability claim breaks down.
Observability is often treated as a purchasing decision: install enough tooling and the system becomes transparent. In practice it is a property of a system relative to the questions a team needs to ask of it. The observability entry defines that relationship, and the OpenTelemetry traces document one signal that makes it concrete; the real problem is evaluating whether the signals a system already emits can answer an actual question.
Direct answer: Evaluate observability by naming a real question about a system and checking whether the existing telemetry can answer it. The sources define observability as inferring internal state from external outputs and describe traces as recorded request paths; the evaluation procedure is a synthesis. A tool inventory is not evidence that any specific question is answerable.
Delta: This article adds a claim-status table and a question-to-signal test beyond the sources: it maps each question to the signal that answers it, with claim status explicit.
The mechanism
Observability originates in control theory, where it measures how well the internal state of a system can be inferred from its external outputs. In software systems it describes the ability to understand what is happening inside a deployment from the telemetry it emits, without shipping new code to ask the question. The common signals are logs, metrics, and traces. The practical consequence is that observability is defined by the questions a team can answer, not by the volume of data it collects. A system that emits a large volume of logs but cannot explain why one request was slow is less observable than a smaller system whose signals answer that question cleanly.
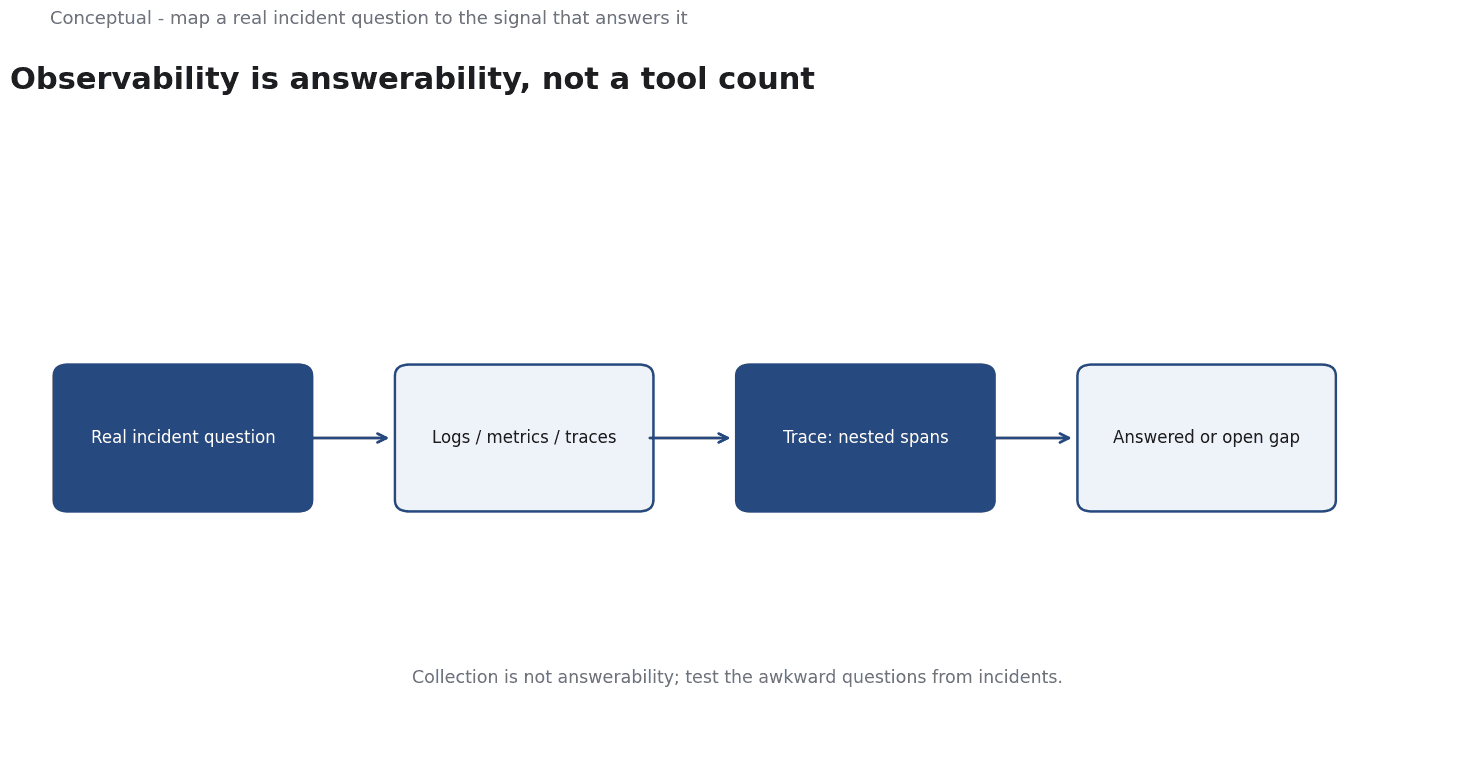
OpenTelemetry describes a trace as the path a request takes through a distributed system, recorded as a set of spans. A span represents a unit of work, with a name, a start and end time, attributes, and a parent that places it within the wider operation. Spans nest and carry context across service boundaries, which is what lets a team reconstruct a single request as it moves through several components. The practical consequence is that traces supply the causal and timing detail that logs and metrics alone do not: they show where time was spent and which service contributed to a failure. This is the instrument for the why question that observability promises.
The sources connect at a point neither states directly. Observability is a property of a system relative to the questions asked of it; traces are one signal that can answer a subset of those questions.
Evaluating observability therefore means testing whether a real question can be answered with the signals that exist.
A team picks a question it actually needed to answer during an incident, then checks whether the current telemetry resolves it. That test is inferred, because neither source prescribes an evaluation procedure; it follows from treating observability as answerability rather than as a tool inventory. It should be recorded as a local method and revisited when the system's architecture changes.
The output is a short list of questions mapped to the signals that answer them, with gaps marked. That list, rather than a dashboard count, is the decision instrument. It shows where the team can diagnose a problem and where it would be guessing. Because each row names a question and a signal, a reviewer can later tell which gaps were accepted and which were closed. The value lies in making answerability explicit: a system is observable to the degree that the questions a team needs to ask are answerable from what it emits.
A worked example
The following is hypothetical and illustrative. A team evaluates whether it can diagnose latency in a checkout flow. Three checks decide the verdict. First, can the team name a real question from a recent incident, such as which service added delay to a slow checkout? Second, does a trace exist that spans the request across each service boundary, with spans that show timing? Third, is the trace retained long enough and sampled densely enough to include the slow cases rather than only the fast ones? The review finds that traces cover the path but sampling drops the slow requests, so the question cannot be answered reliably. The outcome is a decision to adjust sampling before adding more dashboards. The scenario is hypothetical; the verification method is the contribution.
Evidence status
| Claim | Status | Source | Verified | Recheck when |
|---|---|---|---|---|
| Observability infers internal state from external outputs | source-reported | Wikipedia, Observability | 2026-11-18 | Definition revised |
| Traces record a request path as nested spans | source-reported | OpenTelemetry, Traces | 2026-11-18 | Spec version changes |
| Evaluate by answering real questions with existing signals | inferred | Derived from the sources | 2026-11-18 | Architecture changes |
The first two rows restate definitions the sources give directly. The third is an inference about how to evaluate a system, because neither source provides a test procedure. Recheck the first row when the definition changes, the second when the trace specification changes, and the third whenever the architecture or the questions being asked change.
What it cannot do
An evaluation of this kind does not make a system observable. It records which questions can currently be answered; it does not create the signals needed to answer the rest. The sources define observability and describe traces, not a method for installing telemetry. Reading the evaluation as a certificate of observability is a category error: it answers whether specific questions were answerable at the time of the check, not whether the system is understandable in general. A team that needs to diagnose a novel failure must look to the signals themselves, not to the result of a past evaluation.
The hidden cost is that answering a question well is expensive. Traces with enough detail to explain a distributed failure carry a price in storage, sampling decisions, and processing, and every added span is data the team must keep and query. The evaluation makes those costs visible by tying each question to a signal, but it does not remove them. The practical consequence is a budget decision: a team cannot instrument every possible question, so it must choose which questions matter enough to pay for. Ignoring that choice produces either blind spots or a telemetry bill that outgrows the system it observes.
Teams add exporters and dashboards and treat the count of signals as evidence of observability, while the questions that caused the last incident remain unanswered. The sources do not describe this confusion, so it must be caught locally. A second failure mode is evaluation against comfortable questions: a team tests questions it already knows how to answer and declares success. A defensible evaluation uses the awkward questions from real incidents, because those are the ones that expose gaps. Without them, the exercise confirms only what the team already knows.
There is a boundary around the method. It covers questions that telemetry can answer, not causes that leave no signal. A bug that corrupts state without emitting a trace, a dependency that fails outside the instrumented path, and a configuration mistake made before telemetry existed are all outside its reach. It does not replace domain knowledge of how the system behaves, because it evaluates signals rather than supplying understanding of the system. An evaluation cannot tell an engineer what is happening; it can only show whether the evidence needed to find out is available. That is a narrower contribution than the word observability often implies.
Because the system and the signals change, the evaluation needs a refresh. Each question should carry a recheck condition, and the mapping from question to signal should be treated as a local decision rather than a value the sources provide. A new service, a changed sampling rate, or a shorter retention window can invalidate a previously answerable question. Without a record, a future reviewer cannot tell which gaps were accepted deliberately and which appeared quietly. The evaluation list will still exist; the questions behind it are what make the review possible.
The counterargument that collecting more signals is fair for broad visibility is incomplete when no real question has been tested against them.
A decision test
- Pick a real question from a recent incident.
- Name the signal that would answer it.
- Confirm that the signal exists for the relevant path.
- Check retention and sampling against the case in question.
- Mark the question answered or the gap open.
- Record each gap with a recheck condition.
- Repeat when the architecture or sampling changes.
Treat the result as a list of answerable questions rather than a score. The test turns a vague goal such as improve observability into a set of checks with a visible rationale, so a reviewer can see which signals answer which questions and when a gap must be revisited. For further reading, see Data Quality in Practice.
References & Further Reading
- Wikipedia contributors, 2026. Observability - Wikipedia — Inferring internal state from external signals.
- OpenTelemetry, 2026. Traces | OpenTelemetry — Primary documentation on distributed traces, spans and context propagation.