How to Evaluate Retention Analytics
Retention analytics mixes account-level churn with session-level web metrics. Learn the evaluation checks, a worked reconciliation, and where the numbers mislead.
Customer retention is often evaluated with the same numbers used to describe website traffic, but the two measure different things. A returning visitor is a session-level event, while a retained customer is a relationship that persists across billing periods. The real problem is that a polished retention dashboard can report healthy engagement while the business quietly loses accounts.
Direct answer: Evaluate retention analytics by first naming the decision the number must support, then checking that the metric's unit, window, and formula match that decision. The customer retention source defines retention and churn as complementary measures of keeping customers over time, while the web analytics source describes session and visitor metrics. Reconcile the two before trusting either.
Delta: This article adds a claim-status table and an evaluation decision test beyond the sources: it maps each retention metric to a business decision, with claim status explicit.
The mechanism
The customer retention entry defines retention as the ability of a business to keep its customers over a period, with the retention rate expressing the share that remain and churn describing the complement that leave. That definition carries two dependencies that are easy to overlook. The first is the unit: a customer can be an account, a person, or a subscription, and each yields a different rate. The second is the window: a monthly figure and an annual one answer different questions even when computed from the same records. A number quoted without its unit and window is not yet evidence.
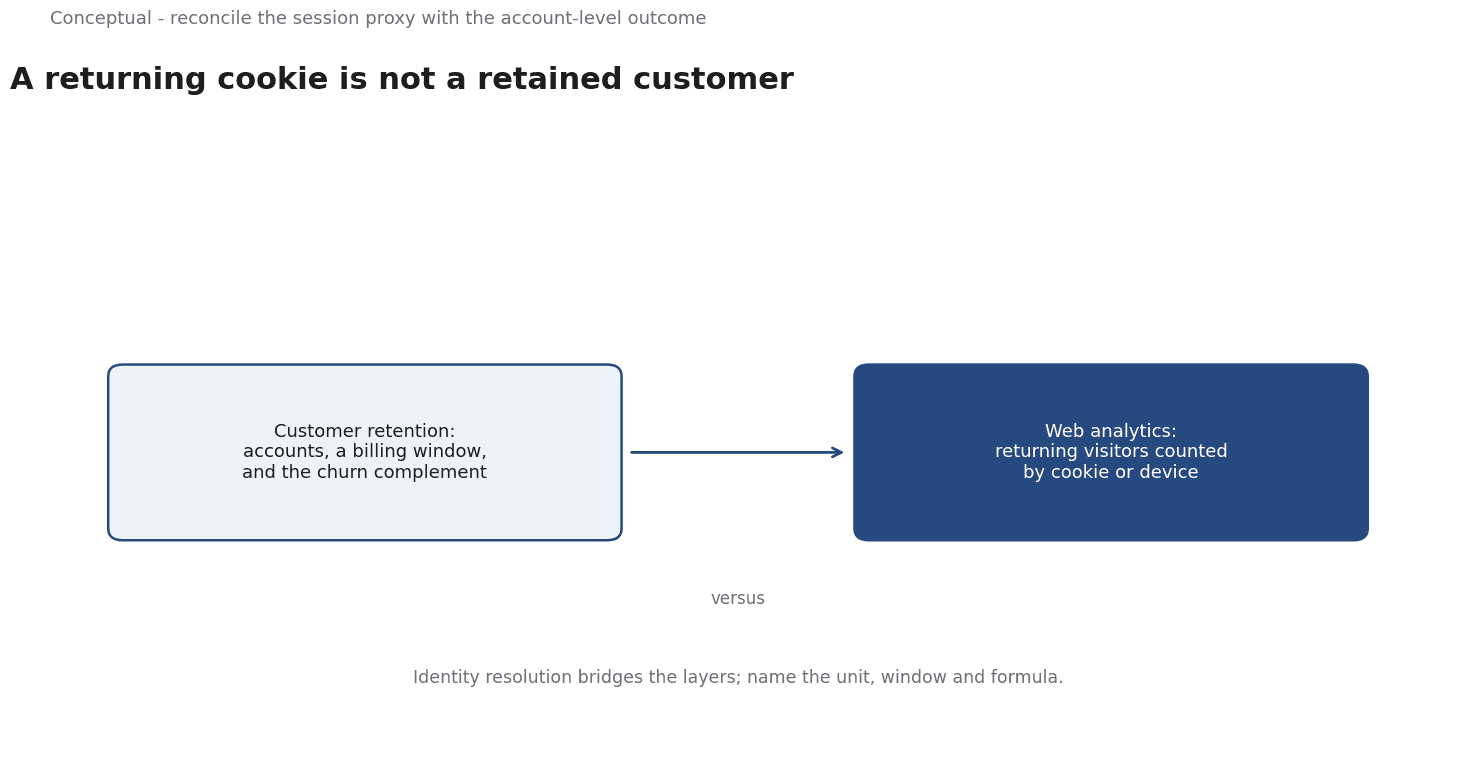
The web analytics entry describes a different layer. It covers the measurement, collection, analysis and reporting of web usage data, with familiar metrics such as unique visitors, sessions, page views, bounce rate and time on site, gathered through log files, JavaScript tags and cookies. These are interaction measures. A returning visitor usually means a returning cookie or device, not a returning customer. Shared devices, cleared cookies and multiple browsers break the intuitive link between a web visit and a person who actually pays the business.
Evaluation is the act of checking alignment between those layers and the decision at hand.
If the decision concerns loyalty or lifetime value, a session-based proxy is the wrong instrument, because it counts attention rather than commitment. Identity resolution is the bridge that makes web events and customer records comparable, and it is an assumption-heavy process rather than a fact delivered by the tooling. The sources define the two domains; they do not guarantee that the numbers line up.
The output of a sound evaluation is a short set of questions applied to every retention figure: what is the unit, what is the window, how is the complement computed, and does an independent outcome confirm it? Keeping each answer visible lets a reviewer see what the metric does and does not measure.
A worked example
The following is hypothetical and illustrative. A subscription business treats a web analytics "returning visitor rate" as its retention metric. Three checks decide the review. First, the unit: the web metric counts cookies while billing churn counts accounts, so shared devices create false returns. Second, the window: the dashboard uses a rolling thirty days while contracts renew annually, so the periods cannot be compared directly. Third, the complement: one minus the reported retention does not reconcile with observed cancellations. After re-keying web events to account identifiers and aligning the window to the billing cycle, the retention figure falls and now tracks billing churn. The numbers are hypothetical; the reconciliation method is the contribution.
Evidence status
| Claim | Status | Source | Verified | Recheck when |
|---|---|---|---|---|
| Retention rate and churn are complementary measures of keeping customers over time | source-reported | Wikipedia, Customer retention | 2026-11-18 | Definition revised |
| Web analytics measures interaction metrics such as unique visitors and sessions | source-reported | Wikipedia, Web analytics | 2026-11-18 | Metrics taxonomy changes |
| Cookie-based returning visits overstate account-level retention | inferred | Derived from the sources | 2026-11-18 | Identity scheme changes |
The first two rows are factual claims drawn from the sources. The third is an inference about what cookie-based counting does to a retention proxy, because neither source endorses a particular identity scheme. Recheck the definitions when the source entries change, and the inferred claim whenever tracking or identity resolution changes.
What it cannot do
Retention analytics cannot explain why customers stay or leave. Both sources describe measurement: one defines retention and churn, the other defines web usage metrics. Neither supplies a causal account of loyalty. A rising retention rate can follow from a pricing change, a product improvement, or simply from customers who were going to leave already having left. The number describes the shape of a pattern, not its cause, and treating it as a diagnosis invites confident but unfounded stories about what is working.
The hidden cost sits in identity and definitions. Linking a cookie-based visit to a known account requires a key that survives logins, device changes and privacy controls. Cookies expire, users clear them, and households share devices, so the linkage decays unless it is maintained. Each definition, including the unit, the window and the exclusion rules, needs documentation and agreement across teams. That maintenance is recurring work paid in attention and coordination, not a one-time setup that the tooling makes disappear.
Once a web engagement figure is labelled retention, teams begin optimizing it, and the metric drifts away from the business outcome it was meant to represent. A campaign can lift returning visits without changing a single renewal decision. Because the dashboard is easy to read and updates quickly, the proxy attracts more attention than the slower, more authoritative churn figure. The result is activity that looks like progress while the underlying relationship is unchanged.
There is a boundary around what the measurement window can show. Short windows flatter retention because few customers have had time to leave, and a cohort defined too broadly can mix very different customer types. Offline interactions, word of mouth and cancellations handled outside the tracked systems never appear. The web analytics source is concerned with web usage, and the retention source with the fact of retaining customers; neither captures the full commercial context in which a decision to stay is made.
Because tracking and behavior change, the evaluation needs periodic review. Browser privacy controls, consent rules and tagging changes alter what web analytics can observe, so a metric that was once a reasonable proxy can degrade silently. Each definition should carry a recheck condition and an owner. Without that record, a future reader cannot tell whether a shift in the retention figure reflects customer behavior or a change in how the number was collected.
The counterargument that web engagement metrics are fair for measuring site stickiness is incomplete when the decision concerns actual customer churn.
A decision test
- State the decision the retention number must support.
- Name the unit of analysis: account, person, device or cookie.
- Define the retention window and the cohort.
- Spell out the retention formula and its churn complement.
- Check identity resolution between web events and customer records.
- Reconcile the proxy with an independent outcome such as billing churn.
- Record definitions, recheck triggers and an owner for the metric.
The evaluation is useful only when the metric's unit, window and formula are owned and visible. The test turns a dashboard figure into a sequence of checks, so a reviewer can see whether the number measures engagement or the customer relationship the business actually cares about. For further reading, see Marketing Dashboards without the Hype.
References & Further Reading
- Wikipedia contributors, 2026. Customer retention - Wikipedia — Efforts to keep existing customers.
- Wikipedia contributors, 2026. Web analytics - Wikipedia — Collection and interpretation of website behaviour data.