Inflation Adjustment: Common Questions
Common questions about inflation adjustment answered with bounded claims: why nominal values mislead, which index to use, and where the method breaks down.
Numbers from different years are not directly comparable when the price level changes. A salary that doubled over a decade can represent less purchasing power if prices rose faster, yet nominal figures hide this. The practical question is which price index to apply and what the adjusted number can legitimately claim.
Direct answer:
Inflation adjustment converts a nominal value into a real value by dividing by a price index referenced to a chosen base year.
The inflation source describes a general rise in prices and the erosion of purchasing power; FRED supplies dated economic series used as indices. The boundary: an adjusted figure is only as good as the index choice and the base year.
Delta: This article adds an index-choice map beyond the two sources: it maps the question asked to the series selected, with claim status explicit.
The mechanism
The inflation source describes inflation as a sustained increase in the general price level, which reduces the purchasing power of a unit of currency. The practical consequence is that a nominal amount carries two things at once: a quantity of money and the price level at which that money was measured. Adjusting for inflation separates them. Without that separation, a comparison across years mixes a change in real resources with a change in the unit of account.
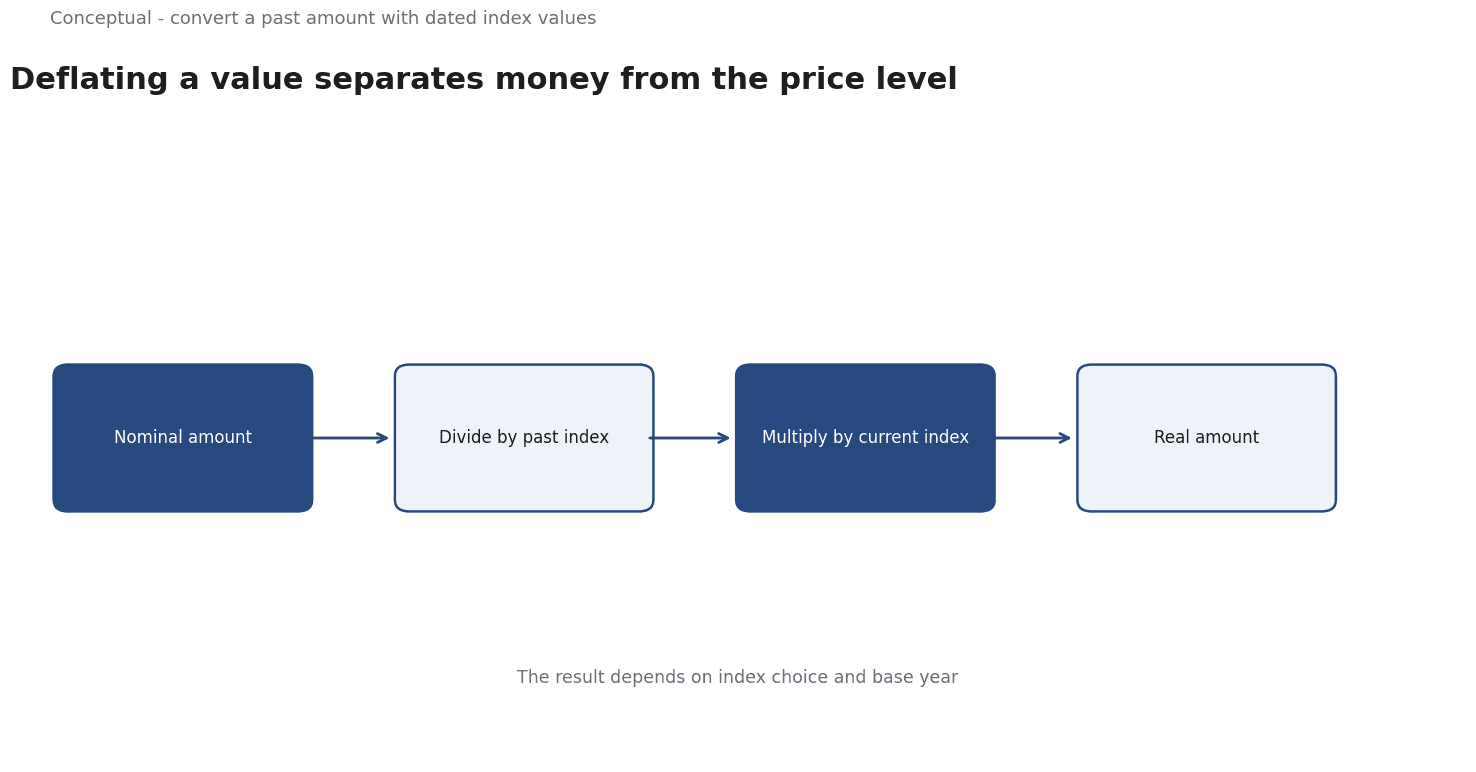
The mechanics are simple but the choices are not. To express a past amount in current terms, you divide by the index value in the past year and multiply by the index value in the current year. The result depends on the index: a consumer price index tracks a basket of household goods, while other series track producer prices or a broader deflator. FRED publishes many such series as dated observations, so the analyst must pick the one whose coverage matches the question. A wage comparison calls for a consumer series; a capital spending comparison may call for an investment deflator.
Base-year choice is another decision that is easy to overlook. An index is normalized so that a chosen year equals a reference value, but the ratio between two years is what actually matters for adjustment. Changing the base year rescales all values without changing the real relationship between them. The practical consequence is that a figure reported in constant 2020 currency is a presentation choice, not a different fact, and the base should be stated so readers can compare like with like.
Frequency and revisions matter too. Some series are monthly, others annual, and many are revised as better data arrives. FRED records observation dates and vintage information, which lets an analyst see what was known at a given time. The consequence is that an adjustment made today and one made next year can differ even with the same method, because the underlying series was revised. A defensible adjustment therefore records the series identifier, the observation dates, and the access date.
A worked example
The following is hypothetical and illustrative. An analyst compares a 2016 program budget with a 2026 proposal and wants both in the same real terms. Three checks guide the work. First, choose the index: if the budget is household-facing, a consumer price series fits; if it is equipment-heavy, an investment deflator fits better. Second, set the base: state that figures are expressed in 2026 currency and apply the ratio of the 2026 index to the 2016 index. Third, record the series identifier and access date, since revisions can change the 2016 observation. In this hypothetical case, the analyst finds that the nominal increase largely disappears after adjustment and reports both the raw and real figures with the series named.
Evidence status
| Claim | Status | Source | Verified | Recheck when |
|---|---|---|---|---|
| Inflation is a general rise in prices that reduces purchasing power | source-reported | Wikipedia: Inflation | 2026-11-18 | Definition or measurement method changes |
| FRED publishes dated economic series usable as price indices | source-reported | FRED | 2026-11-18 | Series are revised or discontinued |
| Nominal values must be deflated to compare across years | inferred | Derived from the sources | 2026-11-18 | Base year or index series changes |
The table distinguishes reference statements from inference. The inflation definition and the data-availability row are reported from the sources, not established by measurement here. The final row follows logically from those premises but still depends on choosing an appropriate series, so it must be revisited when the index or base year changes.
What it cannot do
Inflation adjustment cannot tell you which index is right for your question. It can only apply the one you choose. A consumer price index reflects the spending pattern of a typical household, which may bear little resemblance to a firm's input costs or a specific city's rents. The consequence is that two analysts using the method correctly can produce different real values, and neither is strictly wrong unless the index is mismatched to the thing being measured. The method is a transformation, not a verdict.
The hidden cost is the chain of small decisions behind an adjusted number: index, base year, frequency, seasonal adjustment, and access date. Each is defensible on its own, but together they create a figure that looks authoritative and is actually conditional.
The cost shows up later when someone tries to reproduce the number and cannot, because the series vintage was never recorded.
A common failure is deflating the wrong thing. Nominal flows such as revenue can be adjusted, but so-called real quantities such as units shipped should not be, because they are already physical measures. Another failure is mixing price indices with exchange rates, which answers a different question about cross-currency comparison. A subtler error is comparing a nominal figure to a real one in the same chart, which produces a gap that is purely an artifact of units.
The boundary is what the adjustment means. A real value tells you about purchasing power relative to a basket of goods and a base year. It does not tell you about relative prices within that basket, about quality changes, or about whether a specific household actually faced the average price change. An adjusted salary can rise in real terms while a particular family feels worse off if its spending is concentrated in categories that rose faster.
The method answers an average question, not an individual one.
Indices are revised and series are retired, so an adjustment is not a one-time fact. A figure computed from a series vintage that was later revised will differ from one computed today. Teams that rely on adjusted figures for contracts, benchmarks, or historical comparisons should recheck the series and base on a fixed schedule, and keep the computation reproducible. The discipline is not complicated, but it is easy to skip when the adjusted number is only a footnote in a larger analysis.
Counterargument: "The counterargument that a single headline inflation rate is fair for a rough household-level check is incomplete for decisions where the relevant basket differs from the headline one."
A decision test
- State the question the comparison is meant to answer.
- Identify the nominal values and their years or dates.
- Choose an index whose coverage matches the thing being compared.
- State the base year or currency in which results are expressed.
- Apply the index ratio and keep raw and adjusted figures side by side.
- Record the series identifier, observation dates and access date.
- Recheck the series when revisions are released or the question changes.
These steps make the conditional nature of a real value visible instead of hiding it behind a single number. That visibility is what lets a reader challenge the choice of index rather than argue with an opaque result. For a related treatment of dated financial planning, see Cash Flow Forecasting.
References & Further Reading
- Wikipedia contributors, 2026. Inflation - Wikipedia — The definition of inflation, its measurement and its effect on nominal versus real quantities; secondary reference.
- Federal Reserve Bank of St. Louis, 2026. FRED economic data — The primary time-series database used for macro indicators.