Inflation Adjustment Costs Explained
Inflation adjustment converts nominal figures to real terms, but index, base, and scope choices shape the result. A worked example and decision test make those choices explicit.
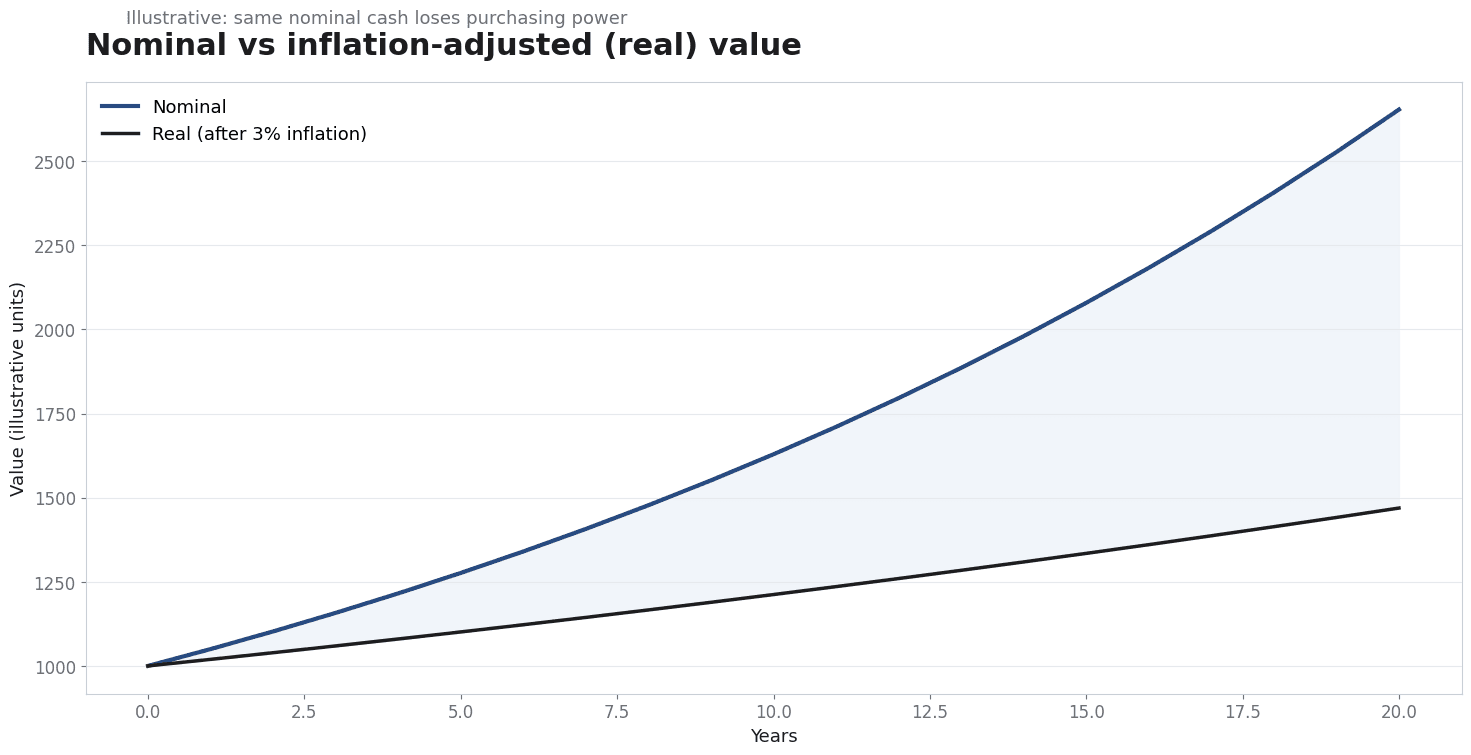
Prices and indexes get adjusted for inflation all the time, but the adjustment itself is rarely free. Teams apply a deflator, publish a real figure, and assume the comparison is now clean. The costs of doing that adjustment badly - or doing it when it is not needed - are usually hidden in the method rather than in the result.
Direct answer: Inflation is a sustained rise in the general price level, which reduces the purchasing power of a currency over time. Adjusting a nominal figure for inflation converts it into real terms so comparisons reflect purchasing power rather than price changes.
The cost is not a fee; it is the judgment and data work required to choose the right index, base period, and scope.
Delta: This article adds a decision framing beyond the sources: it maps inflation-adjustment choices to a concrete comparison decision, with claim status explicit.
The mechanism
Inflation refers to a sustained increase in the general price level of goods and services in an economy over a period, which corresponds to a decline in the purchasing power of the currency. The word general matters: a rise in one price is a relative-price change, not inflation. Confusing the two leads people to adjust individual line items as if each had its own inflation rate, when the concept applies to an economy-wide price level and the available indexes are built to track that aggregate.
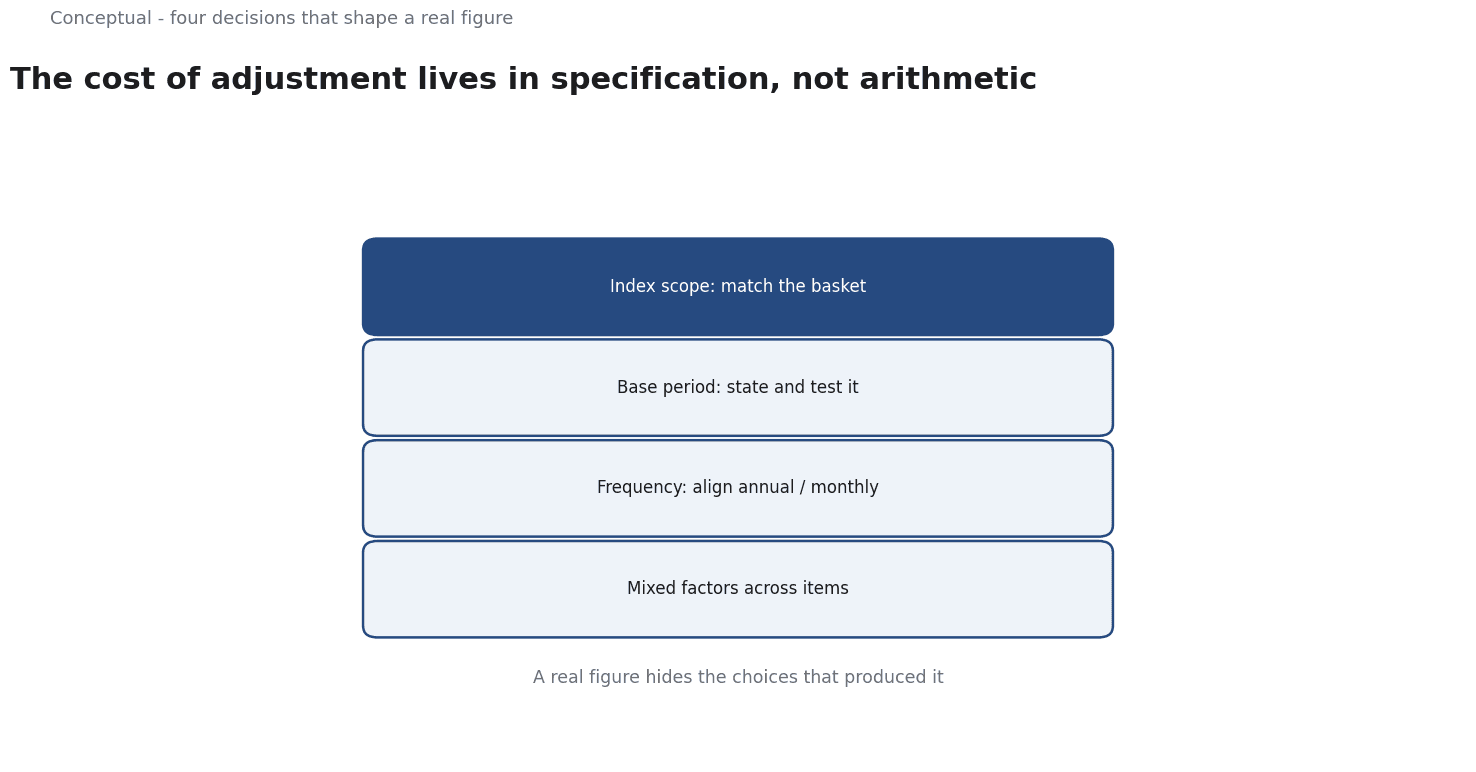
Adjusting for inflation means converting a nominal amount, stated at the prices of its own time, into a real amount expressed in the purchasing power of a chosen base period. The conversion uses a price index or deflator and a base year, and it changes the denominator of every comparison that follows. Because the result depends on which index and base year are chosen, the adjustment is not a mechanical cleanup but a specification decision that should match the question being asked.
Data providers such as the Federal Reserve Bank of St. Louis publish and document large collections of economic time series, including price indexes, through FRED. That availability is useful but also a source of difficulty: several indexes exist, they differ in coverage and methodology, and they are revised. A series chosen because it is convenient may not match the basket whose prices actually affected the figure being adjusted, and a series revised after publication can change a real figure that was already circulated.
The costs of adjustment therefore arise in the specification, not in the arithmetic. Choosing an index with the wrong scope, anchoring to a base year that distorts a particular comparison, mixing annual and monthly frequencies, or applying a single factor across items with different price behavior all produce real figures that look precise but are not comparable. Each of these errors is cheap to make and expensive to detect after the number has been published, because the adjusted figure hides the choices that produced it.
A worked example
The following is hypothetical and illustrative. A team wants to compare a marketing budget from an earlier year with this year's budget and asks whether spending "really" rose. They run three checks. First, an index check: they confirm that the chosen consumer price index covers the categories the budget buys, rather than a narrower producer index. Second, a base-period check: they restate both years in the same base and verify that changing the base does not change the percentage conclusion. Third, a timing check: they align annual figures with annual index averages instead of mixing monthly observations. The outcome is a real-terms comparison that shows a modest increase rather than the large jump suggested by nominal figures, with the index and base recorded alongside the result.
Evidence status
| Claim | Status | Source | Verified | Recheck when |
|---|---|---|---|---|
| Inflation is a sustained rise in the general price level | source-reported | Wikipedia: Inflation | 2026-11-18 | Definition or measurement debate changes |
| FRED publishes documented economic time series including price indexes | source-reported | FRED economic data | 2026-11-18 | Series methodology or revisions change |
| Adjustment error is concentrated in index, base, and scope choices | inferred | Derived from the sources | 2026-11-18 | Index methodology is revised |
The source-reported rows establish what inflation is and where price data can be found; neither dictates a specific adjustment. The inferred row is the article's synthesis of those descriptions into where errors arise, not a sourced finding. Recheck it when index methodologies or series coverage change enough to alter which choices are risky.
What it cannot do
This framing has a definite limit. The sources describe inflation and point to where economic data live; they do not tell you which index to use, which base year is correct, or whether a given figure should be adjusted at all. Those are decisions that depend on the question and the data. Any claim that a particular adjustment is "right" is a judgement about fit, not a fact the sources deliver, so the framework should be read as a checklist for specifying an adjustment rather than a formula that returns one.
A hidden cost is that adjustment can create false precision. Once a figure is expressed in real terms it looks authoritative, and the index and base-year choices that shaped it disappear from view. That makes the result easy to compare and hard to audit. Base-year sensitivity is a specific version of the problem: a change of base can alter the apparent size of a trend, and published series are revised over time, so a real figure that was correct on its publication date can drift. Recording the series identifier, vintage, and base alongside the result is the only reliable defense, and that metadata work is part of the cost.
The main failure mode is using an index whose scope does not match the quantity being adjusted. A consumer price index measures the prices faced by households; it is not automatically the right deflator for a capital budget, a wage bill, or a producer-price series.
A second failure is treating every price change as inflation when it is actually a relative-price shift, then adjusting away information that mattered. A third is publishing the real figure without the nominal one, which prevents a reader from checking the work.
The boundary is when adjustment is appropriate at all. Over very short horizons, or when the decision is governed by nominal contracts, real terms may add complexity without adding insight. Comparisons that are inherently about relative prices, such as the price of one input against another, can be distorted by deflating both sides with the same general index. Inflation adjustment is a tool for a specific kind of question, and applying it reflexively to every number is a source of error rather than clarity.
Adjustments also need review. Index methodologies change, series are revised, and the basket of goods evolves, so an adjustment that was defensible last year may need restating. Keep a record of the series and vintage used, and set a trigger to revisit the specification when methodology changes or when the comparison's purpose shifts. Without that, a real figure becomes a permanent fixture whose assumptions nobody can reconstruct.
The counterargument that inflation adjustment is basically a lookup in a published index is fair for a single, well-matched series and a clear base, and incomplete for comparisons that span categories, revisions, or changing methodology. The work lives in matching the index to the question, not in the division.
A decision test
- Define the comparison. State exactly which two figures are being compared and what the comparison is meant to show.
- Decide whether real terms help. Skip adjustment for nominal contracts, very short horizons, or relative-price questions.
- Choose the index by scope. Match the series to the basket of goods or services the figure represents.
- Fix the base period. State it explicitly and test whether changing it alters the conclusion.
- Align frequencies. Use consistent annual or monthly observations and matching index averages.
- Record the metadata. Save the series identifier, vintage, and base with the adjusted result.
- Set a review trigger. Revisit the specification when the series is revised or the question changes.
Inflation adjustment is an exercise in specification, not arithmetic.
The sources explain what inflation is and where price data are published, but the quality of a real figure depends on index choice, base period, and scope. Make those choices explicitly, record them with the result, and you turn a fragile number into a comparison someone can audit and defend.
For further reading, see Data Quality in Practice.
References & Further Reading
- Wikipedia contributors, 2026. Inflation - Wikipedia — The definition of inflation, its measurement and its effect on nominal versus real quantities; secondary reference.
- Federal Reserve Bank of St. Louis, 2026. FRED economic data — The primary time-series database used for macro indicators.