Inventory Management Trade-Offs
Inventory management trade-offs explain why holding stock is a service-level choice. See the cost tensions, a worked example, the limits of the models, and a decision test.
Inventory is often treated as a number to minimize, as though every unit on a shelf were pure waste. In practice, stock is a buffer that buys reliability, and cutting it without understanding what it does exposes a business to stockouts. The real problem is that the costs of holding inventory and the costs of not holding it move in opposite directions, so there is no single correct level.
Direct answer: Inventory management is the balancing of carrying cost, ordering cost, and stockout cost across a set of items. Wikipedia defines inventory as goods held for sale or use, and its inventory-control overview describes tools such as reorder points, safety stock, economic order quantity, and ABC analysis. The trade-off is that more stock generally reduces stockout risk while tying up capital and raising obsolescence exposure; the right level is a service decision, not a fixed target.
Delta: This article adds a decision framing beyond the sources: it maps each control tool to the cost tension it resolves, with claim status explicit.
The mechanism
Inventory is a deliberate buffer. Wikipedia describes inventory as goods held for eventual sale or use, and the inventory-control entry explains that organizations hold stock partly to decouple supply from demand. Production and delivery are rarely perfectly synchronized with consumption; a buffer absorbs the mismatch. The practical consequence is that inventory should not be judged as waste by default.
It is capital committed to a service level, and the useful question is how much buffer a given item warrants, not whether buffer is allowed at all.
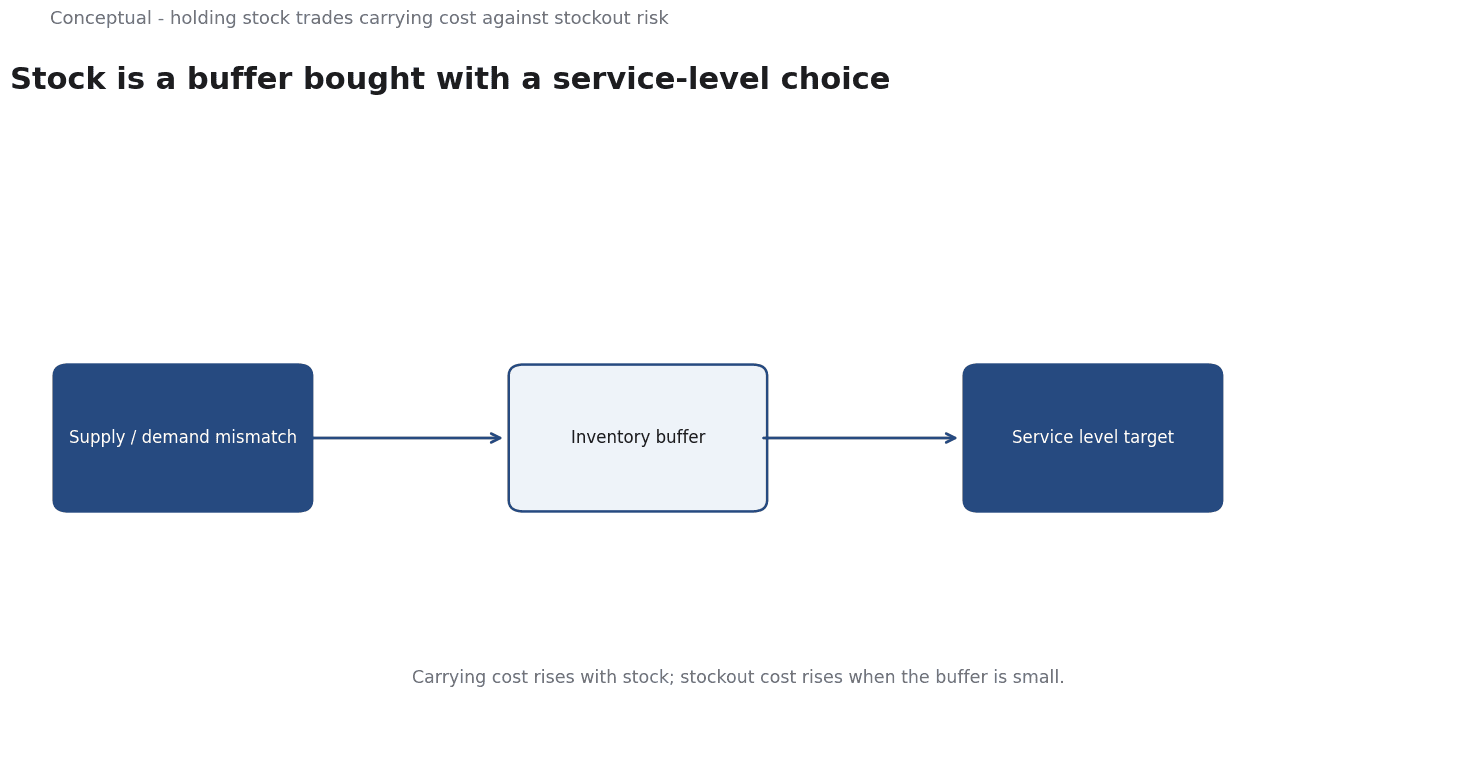
Three cost categories create the tension. Carrying cost - storage, capital tied up, insurance, and obsolescence - rises as average stock rises. Ordering or setup cost falls when orders are larger and less frequent, because fewer orders spread the fixed expense. Stockout cost rises when the buffer is too small to cover variability in demand or lead time.
The practical consequence is that inventory decisions must be stated as a balance among costs, not as a target for a single metric.
The control tools exist to manage specific parts of that balance. Wikipedia's inventory-control overview covers reorder points, which trigger an order when stock falls to a threshold; safety stock, which absorbs variability above expected demand; economic order quantity, which balances ordering against carrying cost; and ABC analysis, which ranks items by importance so attention goes to the few that matter most. The practical consequence is that the right tool depends on the item: a high-value, steady item and a cheap, erratic item should not be managed with the same rule.
This leads to the trade-off framing. Every reduction in average inventory increases exposure to demand or supply variability; every increase commits more capital and raises the risk that stock becomes obsolete before it sells. Because both sides are real, a sensible target is expressed as a service level - how often the item should be available - translated into units. Stating the decision that way makes the cost of reliability visible instead of hiding it inside an operational target that nobody has to defend.
A worked example
The following is hypothetical and illustrative. A retailer stocks a seasonal item with variable weekly demand and reviews it with a single flat rule that orders the same quantity every cycle. Three checks are applied. First, safety stock is set from observed demand variability and lead time rather than from a fixed intuition. Second, an economic-order-quantity calculation balances the cost of placing orders against the cost of carrying stock through the season. Third, ABC analysis identifies this item as high-value, so it receives more frequent review than the low-value items. The outcome is not simply more inventory: higher safety stock before the peak is paired with smaller, better-timed orders, so availability rises while total carrying and ordering cost falls relative to the flat rule.
Evidence status
| Claim | Status | Source | Verified | Recheck when |
|---|---|---|---|---|
| Firms hold inventory to buffer supply and demand variability | source-reported | Inventory (Wikipedia) | 2026-11-18 | Standard descriptions of inventory's role change |
| Inventory control uses reorder points, EOQ, safety stock and ABC analysis | source-reported | Inventory control (Wikipedia) | 2026-11-18 | Control-method references are revised |
| Average inventory and service level trade off against carrying cost | inferred | Derived from the sources | 2026-11-18 | A specific cost model is applied and tested |
The table marks what the sources state separately from what this article infers. The first two rows are reported descriptions of why inventory exists and which tools manage it. The third row is an inferred trade-off, since the sources define the tools but do not rank outcomes for a particular business. It is a way of framing the decision, not a universal optimum.
What it cannot do
The first limit is that the standard models assume stable inputs. Economic order quantity, for example, assumes demand and costs are known and roughly constant. Real demand shifts with seasons, promotions, and competitor actions, and lead times vary with supplier reliability. When the assumptions break, the calculated quantity loses its meaning. The practical response is to treat the model output as a starting point and to re-estimate the inputs when conditions change, rather than following a number computed once and left untouched.
The second limit is a hidden cost that the formulas understate. Carrying cost is easy to list and hard to measure fully: capital could have been deployed elsewhere, storage space has an opportunity cost, and obsolescence is uncertain until it happens. A stock level that looks efficient on a spreadsheet can be expensive once these are priced honestly. This matters most for items with short life cycles, where the true cost of an extra unit is close to its full value if it never sells.
A third failure mode is stale parameters. A reorder point and a safety-stock level are only as good as the demand and lead-time data behind them. If a supplier becomes less reliable or demand quietly trends upward, a once-adequate threshold produces repeated stockouts, and the team may respond by adding buffer everywhere rather than fixing the specific broken input. The discipline is to ask which assumption failed before changing the target.
There is also a boundary to ABC analysis and similar tools. Ranking items by value focuses attention, but it can hide the low-value item whose absence stops a production line. A purely value-based classification misses criticality, and a stockout of a cheap component can cost far more than the item is worth. Any classification should be checked against the actual consequence of running out.
Finally, the practice needs review. Inventory is a dynamic system: new items arrive, suppliers change, and demand patterns age. A quarterly review of parameters, with attention to items whose stockouts or write-offs were frequent, keeps the rules aligned with reality. Without it, the control system preserves an outdated picture of the business.
The counterargument that tight inventory control is pointless when demand is highly uncertain is fair for items where variability dominates and buffer is genuinely needed.
It is incomplete for items with stable demand, where the same uncertainty argument is often used to justify stock levels that the data does not support.
A decision test
- What service level is actually required for this item, and who owns that choice?
- Are the demand and lead-time inputs current rather than inherited?
- Has an economic-order-quantity check balanced ordering against carrying cost?
- Has safety stock been set from observed variability instead of intuition?
- Does the item's classification reflect criticality as well as value?
- Are obsolescence and capital costs included in the carrying-cost estimate?
- Is there a review date to re-estimate parameters when conditions shift?
Together these steps make the trade-off explicit rather than burying it in a reorder setting. The goal is a defensible service level with the cheapest buffer that delivers it, revisited as inputs change. For the cash consequences of stock decisions, see Cash Flow Forecasting: A 13-Week Operating Model.
References & Further Reading
- Wikipedia contributors, 2026. Inventory - Wikipedia — The role of stock in operations and accounting.
- Wikipedia contributors, 2026. Inventory control - Wikipedia — Systems for tracking and managing stock accuracy.