Profitability Ratios Costs Explained
A margin is a summary with an accounting basis. Read what profitability ratios include, a worked example, and where a clean figure misleads.
A profitability ratio looks like a compact verdict: gross margin, operating margin, return on equity. The number is a summary of accounting choices, which is why two companies with the same margin can have different economics, as Reading Financial Statements Without an Accounting Background explains for how figures are constructed, as Earnings Quality: Accruals, Estimates, and Red Flags warns about what a clean number hides.
Direct answer: Profitability ratios measure accounting returns relative to a base — revenue, assets, or equity — and should be read with the definitions and the cash flow behind them. Wikipedia's financial-statement overview provides the structure, and Damodaran's work insists on explicit assumptions. The boundary: a ratio is not cash generation, which the free-cash-flow article explains, and it does not predict the future, which investor education states explicitly.
The ratios and what they include
Gross margin compares revenue minus cost of goods sold to revenue, which the EBITDA article explains for what sits above and below the line. It reflects pricing and production cost, as the pricing-strategy article treats margin as a constraint, as the unit-economics article requires for contribution.
Operating margin subtracts operating expenses, including depreciation and amortisation, which the EBITDA article treats as a non-cash charge with a real economic meaning. A capital-intensive business carries a different burden from a software business, as the free-cash-flow article explains for maintenance spending.
Return on equity divides profit by shareholders' equity, which the valuation article treats as a capital-structure question. Leverage can raise the ratio without improving the business, as the debt-restructuring article explains for how obligations change the denominator, as the credit-spreads article treats risk pricing.
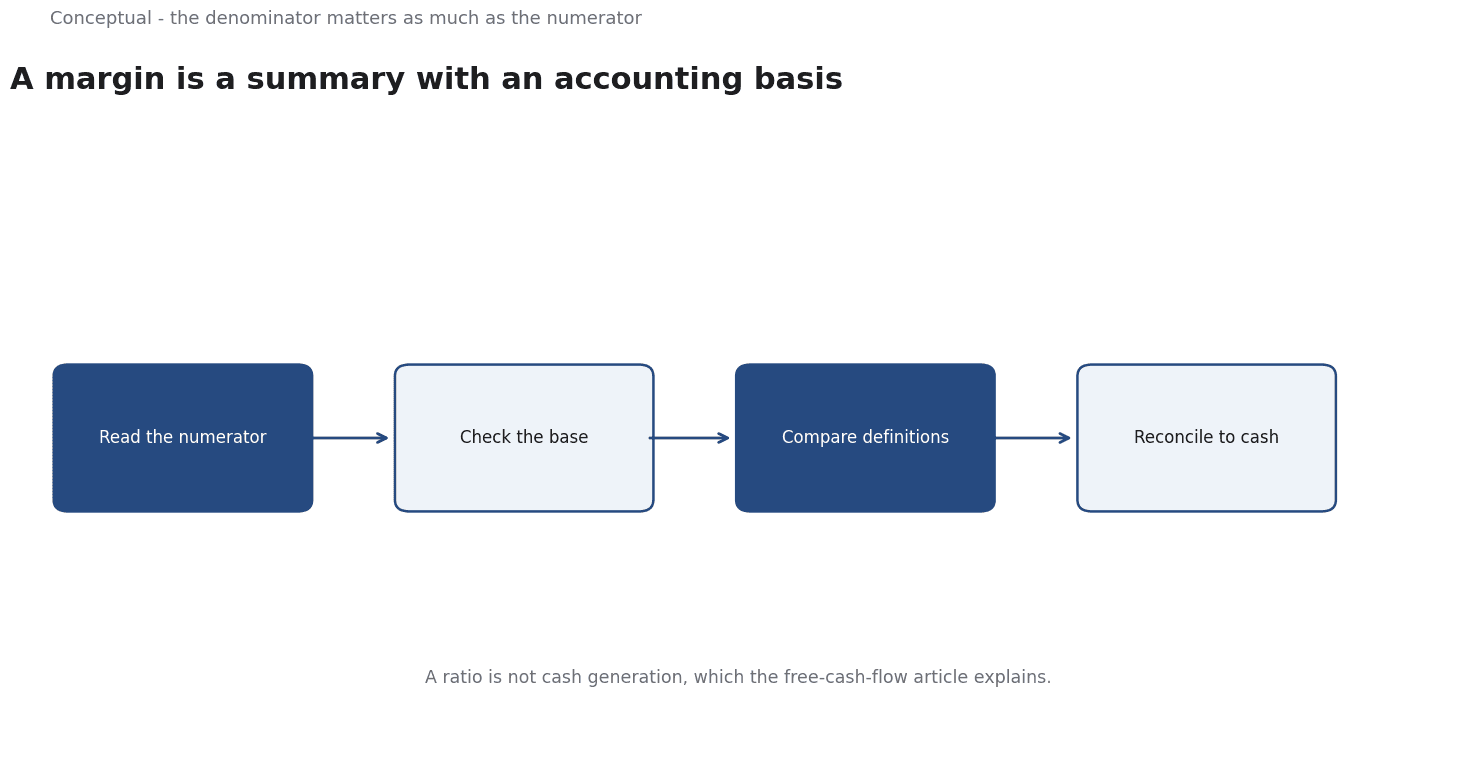
Three consequences follow. The definitions should be checked before comparing companies, which the comparables article requires for consistent adjustments. The ratio should be paired with cash flow, as the free-cash-flow article advises. And it should be read across several periods, which the monitoring article treats as evidence of a trend rather than a snapshot.
A worked example
The following is hypothetical and illustrative. Two companies report a 20% operating margin.
Three checks decide whether they are comparable. First, depreciation: one company owns its assets and records high depreciation, while the other leases them and records rent, which the EBITDA article explains for how the same economic cost appears in different lines, as the cash-flow article requires for reconciliation. Second, leverage: one company has substantially more debt, which the debt article treats as a difference in obligations, as the return-on-equity discussion above explains for the denominator. Third, cash conversion: one company's profit is matched by operating cash flow, while the other's is dominated by receivables, which the cash-flow article treats as a working-capital signal, as Earnings Quality: Accruals, Estimates, and Red Flags warns about accruals.
Three conclusions follow.
The identical margin is not an identical business, which the worked example shows.
The adjustments matter more than the headline ratio, as the comparables article advises. And the decision should be recorded with the definitions, as the decision-memo article requires.
Why the denominator matters as much as the numerator
Return on equity is a good example: a company can raise the figure by taking on debt, which shrinks the denominator without improving operations, as the debt-restructuring article explains for how obligations change a balance sheet, as the credit-spreads article treats the price of that risk. A ratio that looks stronger after a leveraged restructuring may be a weaker business, which the risk-assessment article requires you to state as residual risk.
The same logic applies to return on assets and to margin comparisons across capital structures. A company that leases rather than owns may show a different asset base, which the EBITDA article explains for how the same economic cost appears in different lines, as the comparables article requires consistent adjustments. Without those adjustments, a comparison measures accounting policy as much as performance, which the earnings-quality article warns about for figures that look clean.
For a reader, the practical habit is to ask what changed in the denominator, which the data-governance article requires for any relied-upon figure, as the decision-memo article requires for a recorded judgement. A ratio is a relationship between two numbers, and both deserve the same scrutiny, which the worked example above applies to the numerator alone.
What ratio analysis cannot do
It cannot establish a cause, which the causal-inference article treats as a different question. It cannot predict a return, which investor education states explicitly. And it does not replace an understanding of the business, which the company-analysis article treats as the prior step, as the value-proposition article argues for the buyer's evaluation.
The counterargument that ratios are objective is fair about the arithmetic and wrong about the inputs, which the earnings-quality article warns about estimates, as the EBITDA article treats adjustments as judgements.
A decision test
- Check the definitions behind each ratio, as the comparables article requires.
- Pair profit with operating cash flow, as the free-cash-flow article advises.
- Adjust for capital intensity and lease treatment, as the EBITDA article explains.
- Account for leverage, as the debt article advises.
- Compare across several periods, as the monitoring article recommends.
- Treat a high ratio as a question, as Earnings Quality: Accruals, Estimates, and Red Flags warns.
- Record the decision and the limitations, as the decision-memo article requires.
For the accounting basis, see Reading Financial Statements; for the quality question, see Earnings Quality.
References & Further Reading
- Wikipedia contributors, 2026. Financial statement - Wikipedia — An overview of the four financial statements and the purpose of each; a secondary reference used here with primary documents where available.
- Aswath Damodaran, 2026. Damodaran Online: Home Page for Aswath Damodaran — Publicly maintained datasets for industry averages, WACC, and valuation.