Secondary Markets Metrics that Matter
Secondary markets are judged by volume and liquidity metrics, but a tradeable market does not guarantee a fair-price exit. See the metrics, a worked example, and the limits.
Secondary markets are often described with a handful of numbers: trading volume, bid-ask spreads, and turnover. The Secondary market entry describes a venue where investors trade existing securities, and the Liquidity ratio entry defines ratios that measure the ability to meet short-term obligations from current assets. The real problem is that these metrics describe the market as a whole, while an investor needs to know whether a specific holding can be sold at a fair price on a specific date.
Direct answer:
Secondary-market metrics describe how easily existing securities change hands and how broad a market's liquidity is.
The sources define the market and the liquidity-ratio concept but do not provide a threshold for when a holding is safely exit-able. A market-level metric is therefore context, not a guarantee about one position.
Delta: This article adds a claim-status table and an exit test beyond the sources: it maps each market metric to the exit decision it supports, with claim status explicit.
The mechanism
The Secondary market source describes a market where securities already issued are bought and sold among investors. The practical consequence is that price is set by supply and demand among many participants, which supports price discovery and gives holders a way to convert an asset into cash. Volume and turnover are commonly used indicators of how active that market is. But activity at the market level does not tell an individual holder whether their particular lot can be sold quickly, because the holder's size, the time of day, and the security's characteristics all matter.
The Liquidity ratio source describes ratios that measure a company's ability to meet short-term obligations with its current assets. The practical consequence is that liquidity at the issuer level and liquidity at the market level are different ideas. A company may show healthy liquidity ratios while its shares trade thinly, so an investor who needs to exit could still face a wide spread. Conversely, an actively traded security may belong to an issuer whose liquidity ratios are weak. The two sources describe related but distinct layers, and conflating them leads to wrong conclusions about exit risk.
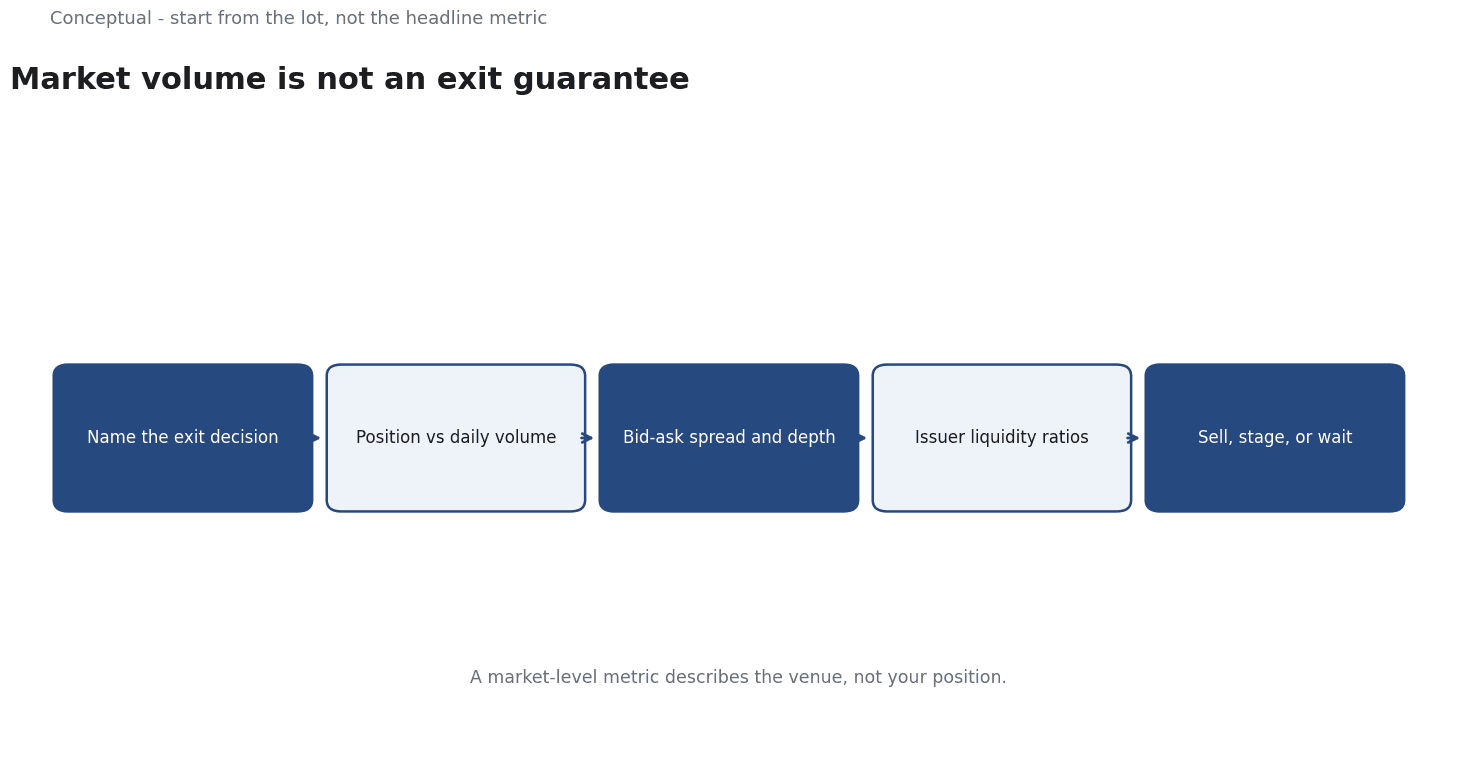
Neither source sets a threshold for adequate trading volume or a spread, nor says which metric governs a decision. That choice is inferred, not source-reported. A useful discipline is to begin with the exit decision: how much must be sold, by when, and with what tolerance for price impact. From that, the relevant metrics are the ones that bear on the specific lot, not the market in aggregate. Starting from the decision keeps a manager from treating a high-volume headline as proof that any position is liquid.
The consequence for practice is to read market metrics alongside a plan for the specific holding. Volume and spreads give a broad indication of activity, while lot size and timing determine the real execution cost. Each metric should have a definition and an owner so trends are read consistently. A market that looks liquid in aggregate can still be a poor place to exit a large position quickly, and the sources do not claim the opposite.
A worked example
The following is hypothetical and illustrative. A fund manager holds a mid-sized position in a security traded on an active secondary market and asks whether it can be exited within a week without moving the price. Three checks decide the review. First, how does the position size compare with average daily volume, which sets how many days of trading the exit would take? Second, what is the current bid-ask spread, which is the immediate cost of crossing the market? Third, does the issuer's liquidity, as suggested by its current ratios, indicate stress that could widen the spread under selling pressure? The review finds that the position equals several days of volume and that the spread is wider than usual. The manager stages the exit over multiple sessions instead of selling at once. The figures are hypothetical; the verification method is the contribution.
Evidence status
| Claim | Status | Source | Verified | Recheck when |
|---|---|---|---|---|
| A secondary market lets investors trade already-issued securities | source-reported | Wikipedia, Secondary market | 2026-11-18 | Definition revised |
| Liquidity ratios measure ability to meet short-term obligations from current assets | source-reported | Wikipedia, Liquidity ratio | 2026-11-18 | Definition revised |
| Market-level volume does not guarantee a fair-price exit for one holding | inferred | Derived from the sources | 2026-11-18 | Trading conditions change |
The first two rows restate definitions from the sources. The third row is a synthesis, since neither source connects market-level activity to the execution of a single position. Recheck when the source definitions change, or when trading conditions, position size, or the bid-ask spread for the holding shift materially.
What it cannot do
Market-level metrics cannot tell you whether a specific holding can be exited at a fair price. Volume and turnover describe aggregate activity, not the depth available at the moment you trade. The Secondary market source describes trading among investors, not an execution guarantee. A security can be actively traded overall and still be thin at a particular time, so a manager who reads headline volume as an exit promise mistakes a market statistic for a trade plan.
The hidden cost sits in the spread and in market impact. Crossing the bid-ask spread is an immediate cost, and a large order can move the price against the seller. These costs are absent from the simple volume figure that makes a market look attractive. The Liquidity ratio source concerns the issuer's balance sheet, not the cost of executing a trade, so relying on either layer alone leaves the true execution cost unmeasured. Investigating depth and impact takes work that the headline metric does not require.
Liquidity can evaporate in stress: the buyers who make a market in normal conditions may withdraw, and spreads widen exactly when an exit is most urgent. Neither source discusses this behavior, so the risk is inferred from the gap between a static metric and a dynamic market. A position that looked easy to sell can become hard to sell at any reasonable price.
There is a boundary around what these sources cover. They describe the existence of secondary markets and the definition of liquidity ratios, not settlement mechanics, market-maker obligations, or the behavior of prices during a crisis. They also do not address how corporate actions, trading halts, or changing registration rules affect the ability to trade. A metric that ignores these factors is a partial view, and the sources do not claim otherwise.
Because trading conditions change, secondary-market metrics need periodic review. Position size relative to volume, the current spread, and the issuer's liquidity should be rechecked against the exit plan, with definitions and recheck dates recorded alongside the figures. Without that record, a stable-looking market can conceal deteriorating depth until a forced sale makes the cost visible. A reviewer should be able to see what was measured and when it was last questioned.
The counterargument that market volume is fair for a broad asset-allocation view is incomplete when it is used to time the exit of one specific position.
A decision test
- Name the exit decision the metric is meant to inform.
- Record the position size and the required exit window.
- Compare the position with average daily trading volume.
- Check the current bid-ask spread and recent market depth.
- Review the issuer's liquidity ratios for signs of stress.
- Decide whether to sell at once, stage the exit, or wait.
- Record definitions, owners, and recheck dates with the metrics.
Secondary-market metrics are context, not a verdict on any one trade. The test ties the numbers to a specific exit and makes size, spread, and timing visible, so a reviewer can see when a liquid market is genuinely accommodating and when it is merely active on paper. For further reading, see Cash Flow Forecasting: A 13-Week Operating Model.
References & Further Reading
- Wikipedia contributors, 2026. Secondary market - Wikipedia — Markets where existing assets change hands.
- Wikipedia contributors, 2026. Liquidity ratio - Wikipedia — Ratios measuring ability to meet short-term obligations.