Sell-out Costs Explained
Sell-through is a ratio, not a full cost. Read how holding costs, markdowns and tied-up capital shape sell-out costs, with a worked example and decision test.
Teams often read sell-through as a clean measure of how well stock is moving. The real problem is that the ratio says nothing about what it cost to reach that number: a high sell-through can hide deep discounting and long holding periods, while a low one can reflect a deliberate build ahead of demand. The cost of selling out lives in the inventory behind the ratio, not in the ratio itself.
Direct answer:
Sell-out cost is the cost of carrying and liquidating inventory on the way to the customer: acquisition, holding, obsolescence, markdowns, and the capital tied up while stock waits.
Sell-through is only the proportion of units sold to units received. The sources define the ratio and the nature of inventory; the cost interpretation is a synthesis.
Delta: This article adds a claim-status table beyond the sources: it maps a sell-through figure to one reorder decision, with claim status explicit.
The mechanism
The sell-through entry defines the rate as the number of units sold divided by the number of units received over a given period, used to gauge how well stock is moving. The mechanism is a simple proportion comparing outflow to inflow within a window. The practical consequence is that the figure is disciplined and easy to compute, but it carries no information about price, margin, or time. A high rate says stock moved; it does not say the movement was profitable. A low rate says stock lingered, which points toward cost, but does not quantify it.
The inventory entry describes goods held for sale as an asset, with costs attached to acquiring, storing, insuring, and eventually obsolescing that stock. The mechanism is that holding inventory consumes resources over time, whether or not a unit ever sells. The practical consequence is that every unsold unit accrues carrying cost for as long as it sits, and the capital spent to buy it is unavailable elsewhere. The time dimension implicit in a sell-through window is exactly where those costs accumulate, yet the ratio counts units, not days or currency.
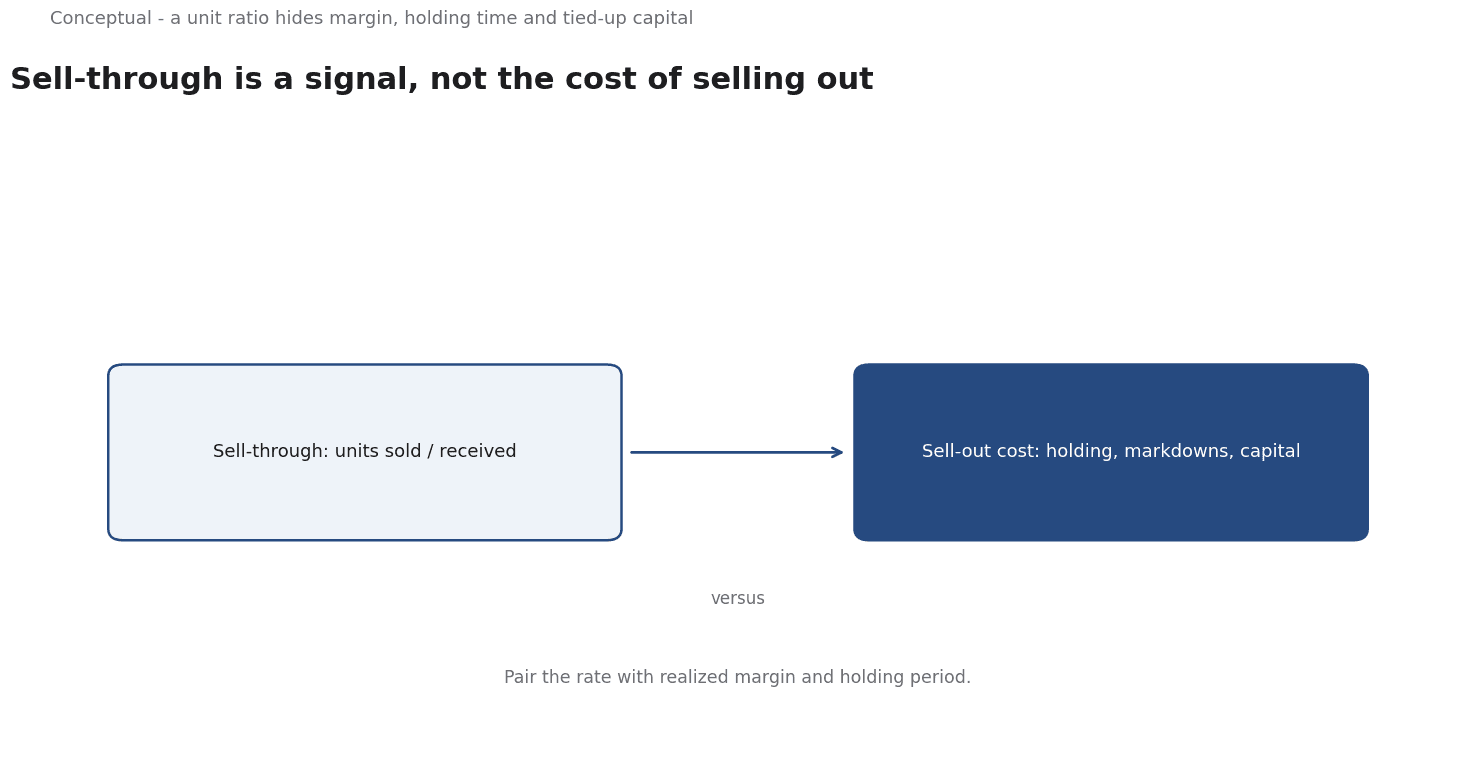
Taken together, the two sources frame sell-through as a signal and inventory cost as the substance behind it. A ninety percent sell-through achieved at full price in four weeks is a different commercial result from ninety percent achieved after a heavy markdown across twelve weeks. The ratio alone cannot tell them apart because both produce the same proportion. The practical consequence is that a team should pair the rate with the margin actually realized and the average holding period, so the cost of achieving the sales is visible alongside the fact that sales occurred.
The final piece is comparison over consistent windows. Sell-through changes with the period chosen, and seasonal categories can look strong or weak depending on where the window falls. The mechanism is a like-for-like baseline: the same interval, the same definition of received units, and the same treatment of returns. The practical consequence is that a reorder decision should rest on a trend across comparable windows rather than a single figure, with the cost of the unsold remainder estimated explicitly. That estimate is an inference, not something either source supplies.
A worked example
The following is hypothetical and illustrative. A retailer receives 1,000 units of a seasonal line and sells 900 of them over eight weeks, reporting a ninety percent sell-through and proposing a larger reorder. Three checks decide. First, the carrying-cost check: what did the 100 unsold units cost to store and insure across those weeks, and how long did the average unit wait before selling? Second, the margin check: what share of the 900 units moved at full price rather than through a markdown, and how did that change the gross margin actually realized? Third, the capital check: how long was the purchase price of the line tied up in stock that had not yet sold? The outcome is a qualified reorder: buy less, buy earlier, and set a markdown trigger before the holding cost erodes the margin. The figures are hypothetical; the sequence of checks is the contribution.
Evidence status
| Claim | Status | Source | Verified | Recheck when |
|---|---|---|---|---|
| Sell-through is the ratio of units sold to units received over a period | source-reported | Sell-through - Wikipedia | 2026-11-18 | when the entry's definition of the rate changes |
| Inventory held for sale carries acquisition, holding and obsolescence costs | source-reported | Inventory - Wikipedia | 2026-11-18 | when the entry's treatment of inventory cost changes |
| Sell-through alone cannot capture the cost of achieving the sales | inferred | Derived from the sources | 2026-11-18 | when cost-accounting guidance ties the rate directly to margin |
The first two rows report what the sources state and can be checked against them directly. The third is an inference: it follows from reading a unit ratio alongside the time-based costs of holding stock, but neither source presents it as a costing rule. Recheck conditions point back to the sources or to new guidance, keeping the status of each row explicit rather than implied.
What it cannot do
Sell-through cannot tell a team whether a sale was profitable. It counts units, not money, so a line that sold through completely at a steep discount looks identical on this measure to one that sold at full price. The cost side of the sale, including the markdown that moved the last units, sits outside the ratio. A manager who uses sell-through as a proxy for profit can scale a line that generates movement while quietly destroying margin, because the measure rewards the emptying of a shelf without asking what the emptying required.
A hidden cost is the capital locked in slow stock. Inventory is an asset, but it is an asset that ties up cash that could fund other work, and the longer a unit waits, the longer that cash is unavailable. This cost rarely appears in a sell-through report, which is expressed in units rather than currency and averaged over a window. There is also a handling burden: stock that lingers must be stored, counted, protected, and eventually marked down or written off. Each of those activities consumes effort that a unit-based ratio renders invisible, so the true cost of a low sell-through is usually larger than it first appears.
Because sell-through is easy to compute and easy to improve by cutting purchases, a team can drive the number up simply by ordering less, then face stockouts and lost demand in the next period. The opposite failure is chasing a high rate with aggressive markdowns that clear the shelf but train customers to wait for discounts. In both cases the measure improves while the underlying commercial position weakens, because the ratio captures neither the lost sales nor the damaged pricing power that produced the change.
The boundary is that these sources define a rate and describe an asset, not a costing standard. The sell-through entry offers a proportion and its use in gauging stock movement; it does not provide a method for pricing the cost of that movement. The inventory entry explains what stock costs to hold; it does not connect those costs to a particular sell-through figure. Using them responsibly means treating the rate as a prompt to look at margin, holding time, and capital, without presenting the pairing as a validated costing model.
Because costs and demand shift, the reading needs scheduled review. Input prices change, storage charges rise, and a holding period that was acceptable in one season can be expensive in the next. The practical requirement is to revisit, on a fixed cadence, whether the assumptions behind the carrying-cost and margin checks still hold and whether the reorder rule built on them still makes sense. Without that review, a team keeps reordering against a cost picture that has quietly gone stale.
The counterargument that sell-through is a useful proxy for inventory health is fair for spotting slow stock and incomplete for pricing the cost of moving it.
A decision test
- Compute sell-through over a defined window with a consistent definition of received units.
- Estimate the holding cost of the unsold remainder for the time it remained in stock.
- Measure the margin actually realized, separating full-price sales from markdowns.
- Work out how long purchase capital was tied up before the stock sold.
- Compare against a like-for-like prior window before calling a trend.
- Set the reorder quantity from the cost picture, not from the rate alone.
- Define a markdown trigger so holding cost cannot drift without a response.
These steps put the ratio back in its proper role as a signal that prompts a cost check. The mapping from a unit proportion and the time-based costs of inventory to one reorder decision is what turns a simple percentage into a defensible operating choice. A passed test leaves a recorded margin, a holding period, and a reorder quantity that can be revisited when conditions change.
For further reading, see Cash Flow Forecasting: A 13-Week Operating Model.
References & Further Reading
- Wikipedia contributors, 2026. Sell-through - Wikipedia — Share of inventory sold from channel.
- Wikipedia contributors, 2026. Inventory - Wikipedia — The role of stock in operations and accounting.