Sensitivity Analysis That Changes a Decision
Most sensitivity tables show which number moves. Read how to find the assumption that would actually change your choice.
A sensitivity table that shows a valuation changing from 180 to 220 million when growth moves by a point is easy to produce and often useless. It tells you that the output depends on the input, which was already assumed. The useful question is different: which input would have to change, and by how much, before the decision itself flips.
Direct answer:
Sensitivity analysis should be organised around the decision threshold, not the output range.
Damodaran's valuation work treats assumptions as explicit drivers, and the financial-modeling article requires inputs with sources. The boundary: a break-even value is a mathematical result, not a statement that the input is likely to reach it, which the scenario-analysis article treats as a separate question of probability.
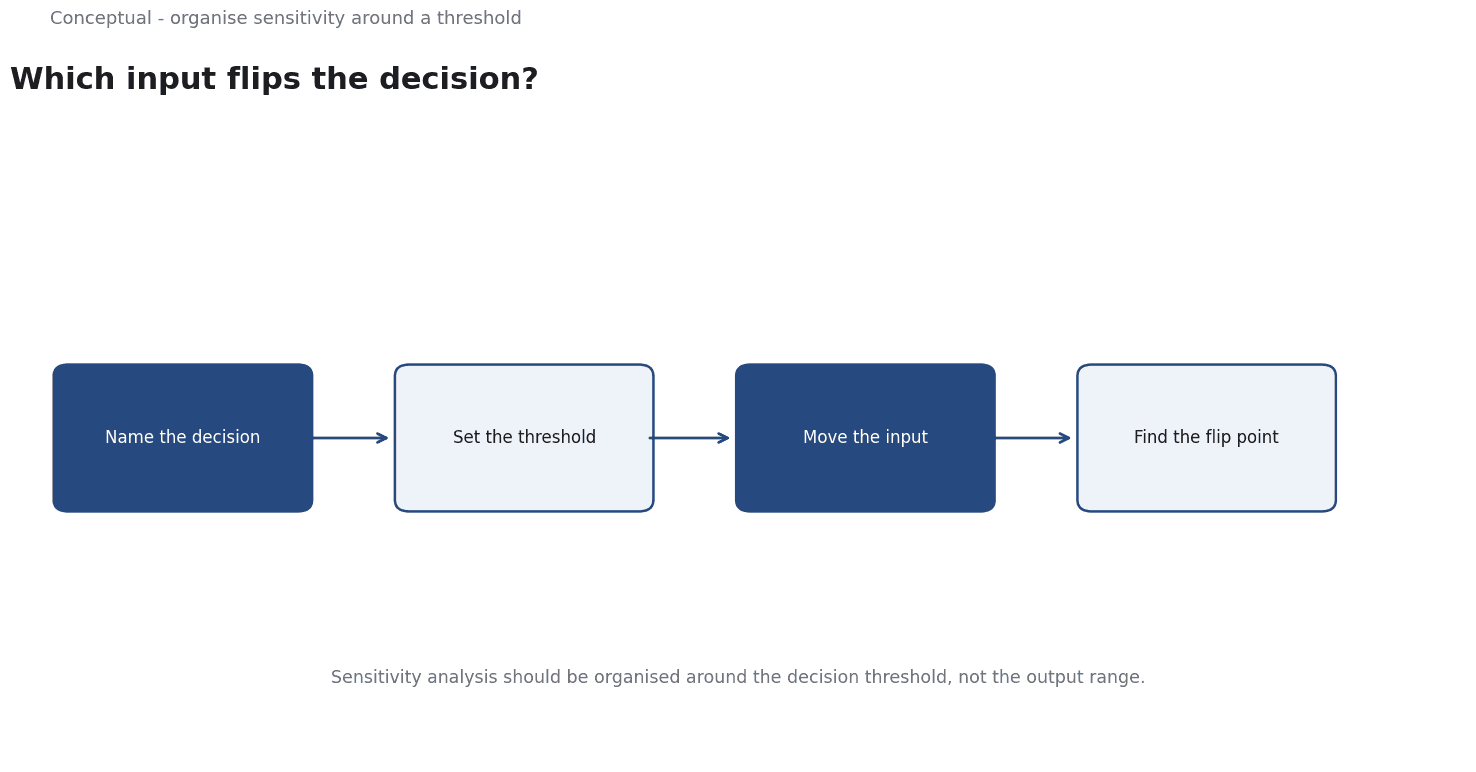
From output range to decision threshold
Start with the decision. If the choice is invest or not invest, the threshold is the value at which the project's return equals the hurdle rate, as the corporate-finance article explains for investment decisions.
Solve backwards. Instead of asking what happens to value when growth changes, ask what growth would need to be for the project to break even. This is the inverse of the usual table and far more informative, as the valuation article argues for explicit drivers.
Compare the required change with the evidence. If growth must rise from 5% to 18% to justify the investment, and historical data supports 4–7%, the decision is robust to uncertainty, which the FRED series with dated observations helps establish. If it must rise to 7%, the decision is fragile, as the risk-assessment article treats residual risk.
Three consequences follow. A small number of assumptions usually dominate, which the Pareto principle in decision analysis predicts and the factor article treats for portfolio tilts. Those assumptions deserve better evidence than the rest, which the data-governance article requires for relied-upon inputs. And the decision should be recorded with the break-even values, as the decision-memo article requires for consequential choices.
A worked example
The following is hypothetical and illustrative. A project costs 10 million and is valued at 14 million using 5% revenue growth, a 30% margin, and a 9% discount rate. It clears the hurdle by 4 million.
Three break-even calculations decide what matters. Growth would need to fall to 1% to destroy the margin of safety. Margin would need to fall to 22%. The discount rate would need to rise to 13%. Three checks follow. First, how plausible is each break-even relative to dated evidence, which FRED supports for rates and the company's own data for margin? A move to 13% in the discount rate may be plausible in a different rate regime, as the real-interest-rates article treats nominal and real changes. Second, which assumption is least controlled by the company? The discount rate is market-driven, while margin is partly within management's control, as the operating-model article explains. Third, does the decision change if two inputs move together, which the scenario-analysis article treats as a question of correlation?
Three conclusions follow. The project is more sensitive to margin than growth in this example, which the break-even comparison shows. The dominant assumption deserves better evidence, as Financial Modeling Best Practices and Common Errors requires. And the result is a range and a threshold, not a point, as the valuation article recommends.
What sensitivity cannot do
It cannot tell you the probability of an input reaching its break-even, which the scenario-analysis article treats as a separate assessment. It cannot account for interactions when inputs move together, which is why correlation and scenarios matter, as the correlation article explains. And it cannot replace a decision: a robust project can still be the wrong strategic choice, which the strategy article argues for positioning before analysis.
The counterargument that a detailed table is more rigorous misses the point.
A decision test
- State the decision threshold before building the table.
- Solve backwards for the break-even value of each input.
- Compare break-even values with dated evidence.
- Rank inputs by how close they are to their break-even, as the valuation article recommends.
- Check combinations of inputs, as Scenario Analysis and Monte Carlo: When to Use Each advises.
- Strengthen evidence for the dominant assumptions, as the data-governance article requires.
- Record the decision with the break-even values, as the decision-memo article requires.
For the modelling method, see Financial Modeling Best Practices; for uncertainty, see Scenario Analysis.
References & Further Reading
- Aswath Damodaran, 2026. Damodaran Online: Home Page for Aswath Damodaran — Publicly maintained datasets for industry averages, WACC, and valuation.
- Wikipedia contributors, 2026. Valuation (finance) - Wikipedia — Overview of absolute and relative valuation approaches; secondary reference.