Scenario Analysis and Monte Carlo: When to Use Each
Two ways to explore uncertainty. Read the difference, a worked example, and when a simple scenario is more honest than a simulation.
A forecast that gives one number hides the range of outcomes that matters for a decision. Scenario analysis and Monte Carlo simulation both address that weakness, and they are often confused. They answer different questions: what happens in a few named futures, and what is the distribution of outcomes across many combinations.
Direct answer: Use scenario analysis when a few named states — base, downside, severe — capture the decision's risk; use Monte Carlo when the interaction of many uncertain inputs matters and a distribution is more informative. Damodaran's valuation work uses scenarios for exactly this purpose, and FRED supplies dated series for input assumptions. The boundary: a simulation is only as good as the input distributions, which the financial-modeling article treats as the assumptions that need explicit sources.
The difference
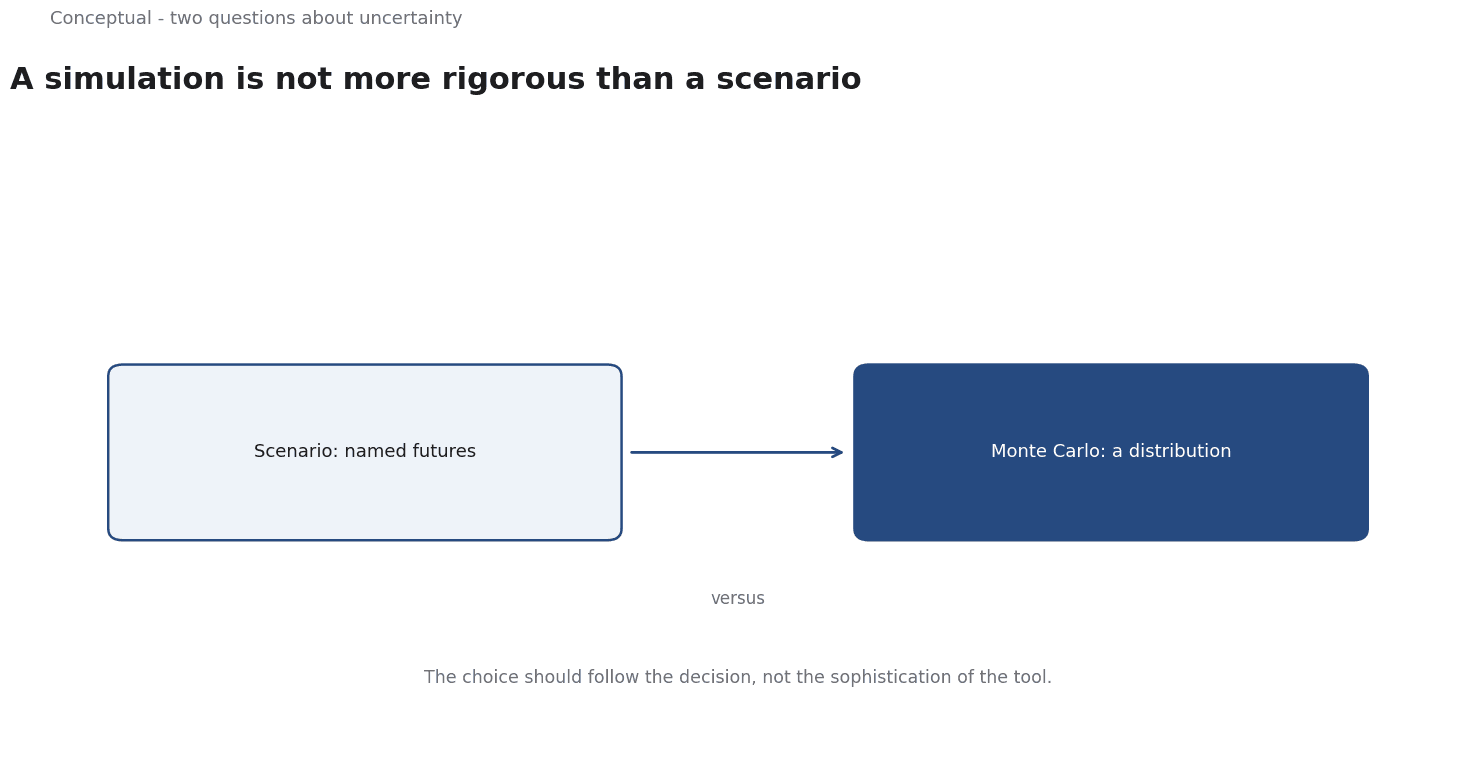
Scenario analysis names a small number of coherent futures. A base case, a downside with lower demand, and a severe case with a financing constraint each tell a story, which the decision-memo article argues for explicit reasoning. The result is easy to communicate and hard to hide behind.
Monte Carlo simulation draws thousands of combinations from input distributions and reports the distribution of outcomes. It is useful when many inputs interact — prices, volumes, costs, rates — and a few named scenarios would miss important combinations, as the risk-assessment article treats interaction effects.
Sensitivity analysis sits between them, changing one input at a time to see which dominates, which the sensitivity article covers as a ranking problem.
Three consequences follow. A simulation with poorly estimated distributions produces precise-looking noise, which the financial-modeling article warns about for any model. Scenarios can miss combinations that lie between the named cases.
And the choice should follow the decision, not the sophistication of the tool, as the valuation article argues for fitting the method to the question.
A worked example
The following is hypothetical and illustrative. A company is deciding whether to invest 10 million in a project with uncertain demand, input costs, and a possible delay.
Scenario analysis defines three cases. Base: demand grows 5%, costs stable, value 15 million. Downside: demand flat, costs up 10%, value 4 million. Severe: demand falls 10%, a six-month delay, value negative 3 million. The decision-memo article would record the assumptions and the owner, which the case analysis requires.
A Monte Carlo simulation draws demand growth, cost inflation, and delay length from distributions based on historical data, which the FRED series helps date, and produces a distribution: a 65% probability of positive value, a 20% chance of value below the 10 million investment, and a 5% chance of a severe loss. Three checks decide what to use. First, are the input distributions defensible with dated sources, as the financial-modeling article requires? Second, does the decision depend on the tails, which the crisis article treats as a question of severe outcomes? Third, can the decision-maker act on a probability distribution, which the behavioural-finance article treats as a real constraint?
Three conclusions follow. Scenarios communicate the story; the simulation quantifies the range, which the valuation article treats as complementary. The dominant assumptions should be ranked, as Sensitivity Analysis That Changes a Decision recommends. And the result should be recorded as a decision with uncertainty stated, as the decision-memo article requires.
What these methods cannot do
They cannot remove uncertainty, which investor education states explicitly. They cannot choose the decision for you; they inform a judgement about risk tolerance, which the asset-allocation article treats as the investor's own. And they do not validate the input assumptions, which the data-governance article requires as a separate step.
A simulation with guessed distributions is less honest than a clearly labelled scenario, which the financial-modeling article treats as a failure of explicit assumptions.
A decision test
- State the decision the analysis must inform.
- Identify the uncertain inputs and their sources, as the financial-modeling article requires.
- Use scenarios for named futures and simulation for interacting inputs.
- Rank the dominant assumptions with sensitivity analysis.
- Report ranges and probabilities, not point estimates.
- Check that the decision-maker can act on the output.
- Record the reasoning, as the decision-memo article requires.
For the ranking step, see Sensitivity Analysis; for the valuation context, see How to Value a Public Company.
For an applied 12-month path forecast using 300 block-bootstrap paths with refitting at each origin, see the BTC Monthly ML case study.
References & Further Reading
- Aswath Damodaran, 2026. Damodaran Online: Home Page for Aswath Damodaran — Publicly maintained datasets for industry averages, WACC, and valuation.
- Federal Reserve Bank of St. Louis, 2026. FRED economic data — The primary time-series database used for macro indicators.