What HTTP Archive’s CDN Numbers Can—and Cannot—Tell You
A careful reading of the 2025 Web Almanac CDN chapter: what its adoption data measures, why site rankings matter, and how to use the results without overgeneralizing.
CDN adoption figures are easy to turn into a sweeping claim: “most websites use a CDN,” or “CDNs make sites faster.” The 2025 Web Almanac’s CDN chapter offers useful measurements, but its own caveats show why those conclusions need qualification. The data describes observed web pages and requests in a defined crawl—not every website, all internet traffic, or a controlled experiment proving that a CDN caused better performance.
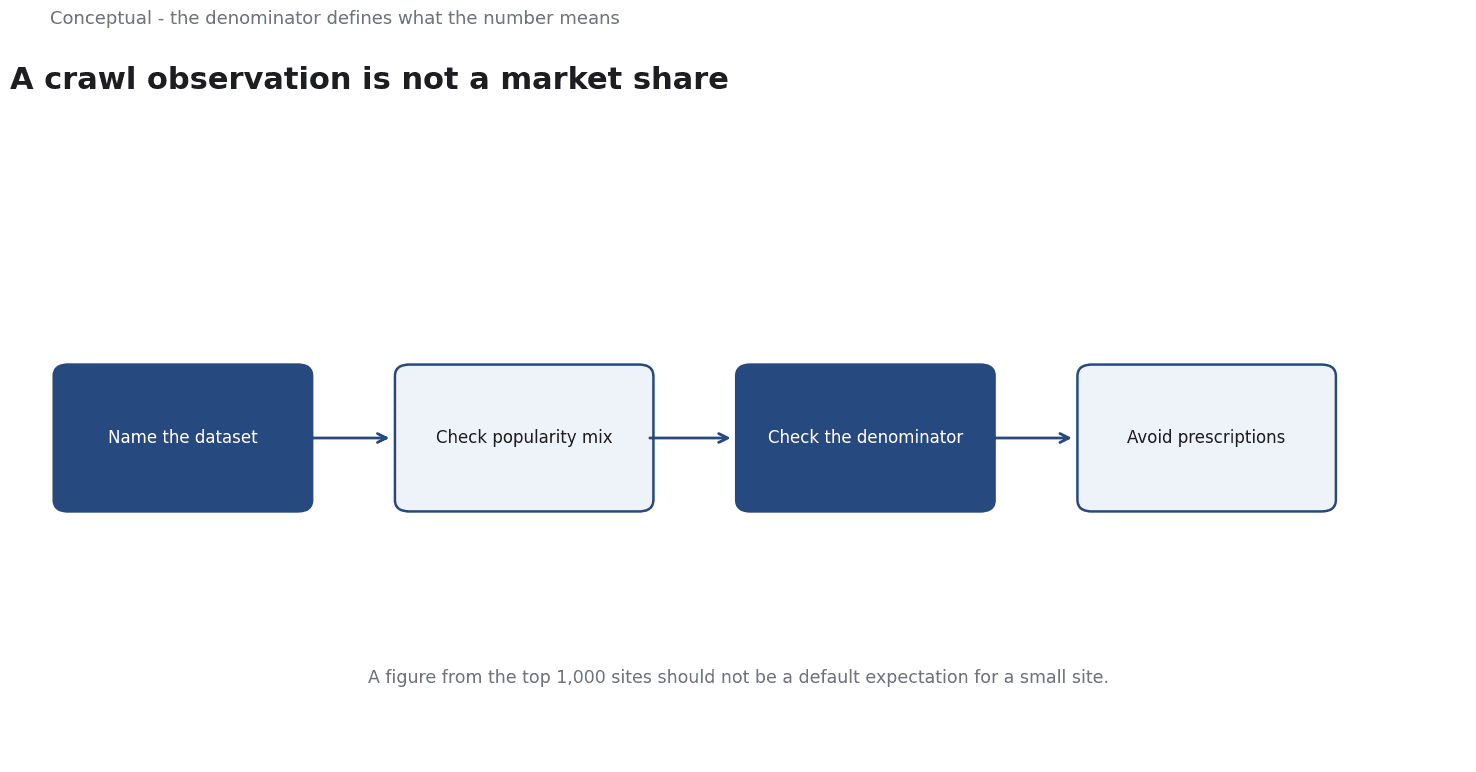
Direct answer: HTTP Archive’s 2025 analysis reports CDN use for 35% of mobile HTML requests, 52% of subdomain requests, and 71% of third-party requests in its dataset. It also reports that CDN adoption varies by site popularity, reaching 71% among the top 1,000 mobile sites and 35% among the top 10 million. These are sample-specific observations, not market-share estimates for all websites. The chapter explicitly cautions that its data shows usage patterns among crawled sites, not true market distribution.
What was measured
The 2025 Web Almanac CDN chapter analyzes page and request characteristics in HTTP Archive’s dataset. It separates requests into categories such as base HTML, subdomain resources, and third-party resources, and compares mobile and desktop observations. Its figures therefore have a denominator: eligible requests or sites in the relevant dataset and category.
That denominator is not “all websites.” The chapter notes that the analysis focuses on popular sites, and its site selection and detection methods shape which properties appear in the results. Its CDN identification and category definitions also matter: a resource’s hosting and delivery path determine how it is classified. The chapter’s adoption percentages are best quoted with their category and device context attached.
For example, “71% of third-party requests were served via a CDN in the mobile dataset” is more faithful than “71% of websites use a CDN.” The first preserves the measured unit; the second changes requests into websites.
Popularity changes the picture
The chapter reports different adoption rates by popularity tier. In the mobile analysis, CDN use is 71% for the top 1,000 sites, 70% for the top 10,000, 62% for the top 100,000, 49% for the top 1 million, and 35% for the top 10 million.
This pattern is useful as a description of the sampled web, but it does not establish that popularity causes CDN adoption. Larger or more visited sites may differ in many ways—architecture, geography, infrastructure budgets, and traffic composition. The reported association cannot isolate those factors or establish the direction of causality.
It also changes the practical interpretation.
Conversely, a low overall share does not mean CDNs are rare in the segment with the highest traffic or most complex delivery needs.
Adoption is not the same as performance impact
The chapter includes performance measurements, but it warns that the comparisons are not uniform tests across CDN providers. Its TLS negotiation and DNS timings come from HTTP Archive’s simulated browser connections on controlled infrastructure; real-world results can vary with geography, network conditions, session resumption, and client devices.
That distinction is central: observing a resource served through a CDN and measuring its response time does not by itself reveal the counterfactual—how the same site, resource, and user would have performed without the CDN. Sites using CDNs may also differ from sites that do not. So the data can describe measured performance under the study conditions, but it should not be restated as a universal causal uplift.
The chapter itself says website owners should perform their own controlled performance testing. For an individual site, compare the same URLs, response conditions, geography, cache state, and measurement window where possible. Track both user-facing outcomes and operational effects; do not treat the presence of a CDN as a performance result.
HTTP/3 illustrates why denominators matter
In the mobile HTML data, the chapter reports that 29% of CDN-served requests used HTTP/3, compared with effectively 0% of origin-served requests in that particular dataset. For third-party requests, the reported HTTP/3 shares are 45% for CDN-served and 7% for origin-served requests.
These comparisons support a narrow observation: HTTP/3 was more commonly observed among the relevant CDN-served requests in this dataset. They do not show that 29% of all web traffic used HTTP/3, nor do they prove that CDN use alone caused the difference. The chapter supplies a useful external comparison: Cloudflare’s own 2025 data reported about 21% global HTTP/3 adoption, substantially below the 69% the Almanac observed for Cloudflare resources in its dataset. That contrast is a concrete warning against treating a sample-specific request rate as an internet-wide rate.
When citing protocol data, keep the request class, device, serving category, and dataset visible. “HTTP/3 adoption” without these qualifiers can refer to very different populations.
A disciplined way to use the chapter
Use the figures as evidence about observed implementation patterns and as prompts for further testing. A practical citation or analysis should:
- Name the edition and year: the 2025 Web Almanac.
- Preserve the unit: sites, pages, or requests—do not substitute one for another.
- State the segment: mobile or desktop, HTML or subresource, CDN or origin, and popularity tier where relevant.
- Describe the source as a crawl/sample, not a census of the internet or total traffic measurement.
- Separate adoption from outcomes: deployment prevalence is not proof of speed, reliability, or business impact.
- Check the chapter’s methodology and caveats before comparing it with vendor reports or later editions.
The chapter is most valuable when treated as a map of what HTTP Archive observed, not as a ranking of providers or a prescription to put every site behind a CDN.
For implementation and cache behavior, see CDN Caching and Googlebot: Avoid Origin Overload. For a related lesson in interpreting grouped data, see Simpson’s Paradox in Your Own Data.
A counterargument
A reasonable critic would argue that the article's central caveat - that the figures are sample-specific and non-causal - is repeated until it displaces the more useful question of what the pattern suggests. The chapter's own gradient (71% CDN use among the top 1,000 mobile sites against 35% among the top 10 million) is, the critic would say, informative even without a causal estimate: it tells a small site that a top-tier figure is not its baseline. The piece also warns against treating sample rates as market share, yet builds that warning on the chapter's Cloudflare comparison (about 21% global versus 69% in-dataset), a vendor figure the reader can only accept through the cited sources.
The caution is correct, but it functions as a substitute for interpretation rather than a frame for it.
References & Further Reading
- HTTP Archive, CDN — The Web Almanac 2025, published in 2025. Primary source for the sampled CDN adoption rates, popularity-tier comparisons, HTTP/3 measurements, controlled measurement conditions, and stated limitations.
- Cloudflare, 2025 Year in Review, 2025. External comparison cited by the Web Almanac for approximately 21% HTTP/3 adoption globally; the Almanac’s 69% observation for Cloudflare resources refers to its own dataset and must not be substituted for this figure.