What the Web Almanac’s E-commerce Adoption Number Measures
The Web Almanac found e-commerce signals on about one in five sampled sites. Learn how detection, Chrome field-data coverage, and site rank limit that estimate.
The Web Almanac's 2025 e-commerce chapter says it detected e-commerce on 19.9% of analyzed desktop sites and 19.2% of analyzed mobile sites. Those figures are easy to paraphrase as "one in five websites sells online." That is broader than what the study measured. The chapter identifies sites through platform and commerce signals in a specific web dataset; it is not a census of businesses, retailers, transactions, or online sales.
Direct answer:
The 19.9% desktop and 19.2% mobile figures are HTTP Archive's detection rates for e-commerce sites within its 2025 analyzed site set.
The chapter says detection depends on Wappalyzer identifying an e-commerce platform or another strong signal. The underlying site set comes from Chrome field-data coverage and is therefore shaped by which sites appear in that ecosystem. Use the percentages to describe this dataset and method—not the share of all businesses or retail sales that are online. The Web Almanac chapter documents both the findings and limitations.
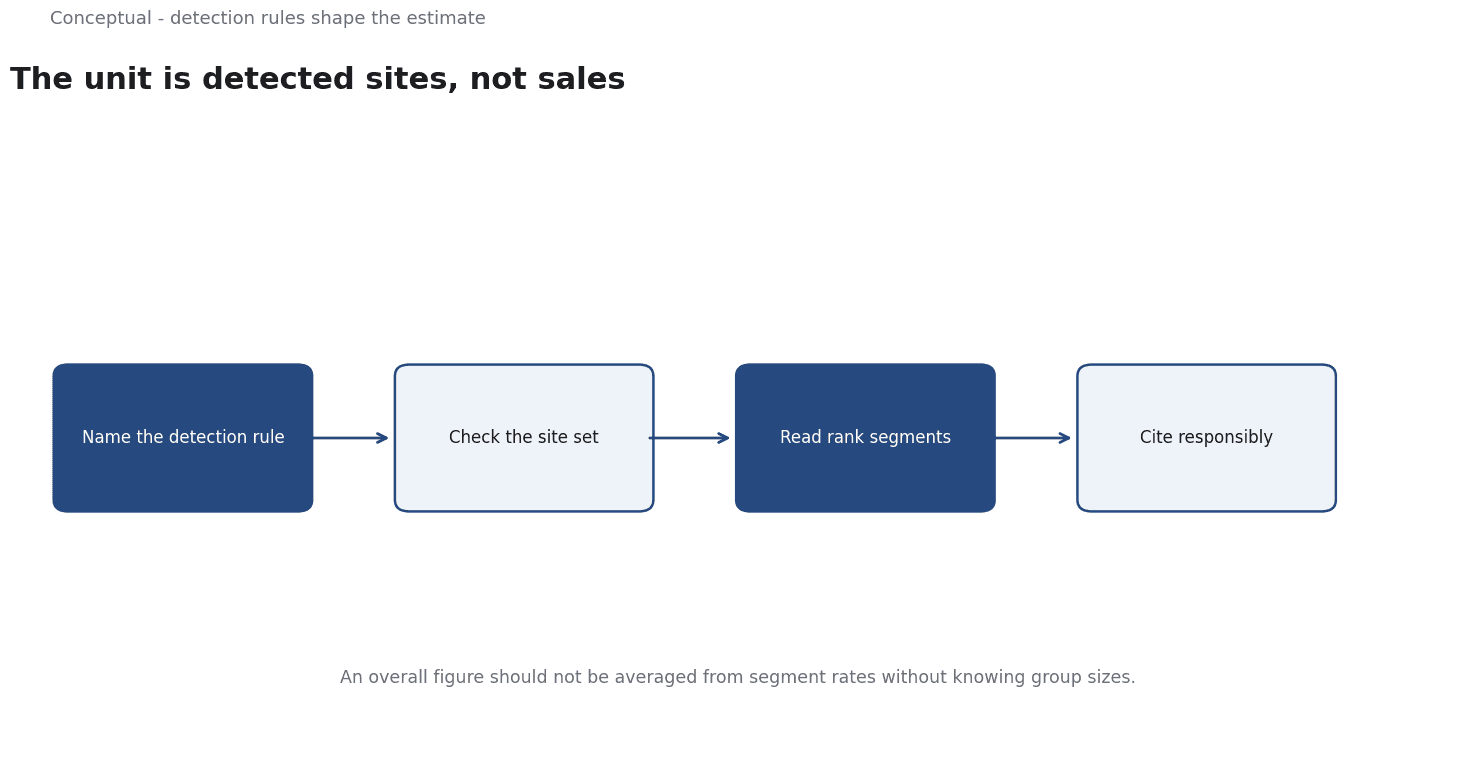
The unit is detected sites, not sales
The chapter’s headline is about the percentage of sites identified as e-commerce sites. It is not a measure of gross merchandise value, order volume, business revenue, or consumer adoption. One large store and one small store each count as a site in an unweighted site-level prevalence statistic, even though their commercial scale may be very different.
That unit also differs from the U.S. Census Bureau’s quarterly retail e-commerce estimate. The Census measure estimates dollars of retail sales meeting its e-commerce definition as a share of total U.S. retail sales. The Web Almanac estimates the prevalence of detected e-commerce sites in a web sample. The two percentages answer different questions and should not be compared as if they shared a numerator, denominator, geography, or method. For the sales measure, see What E-commerce’s Share of Retail Sales Measures.
Detection rules shape the result
HTTP Archive says it can identify an e-commerce site when Wappalyzer detects an e-commerce platform or a strong e-commerce signal. Detecting only a payment processor is not sufficient, because non-store websites may also accept payments.
This is a classification rule, and classification can miss cases. A bespoke store might not expose a known platform signature; conversely, a detected signal is evidence used by the classifier, not a direct audit of the organization’s commercial activity. The chapter states the rule so readers can understand that the result is a detected prevalence estimate, not a verified business registry.
The chapter also notes that the dataset is drawn from Chrome’s field-data ecosystem and thus reflects Chrome users’ visited sites. The authors additionally say that the site set is biased toward sites visited by Chrome users. The implication is not that the result is unusable; it is that its scope must remain attached when interpreting or citing it.
Why rank segments tell a different story
The chapter reports that detected e-commerce adoption varies by site popularity. Its figure indicates roughly 1% among the top 1,000 sites and around 22% desktop / 21% mobile in the top 10 million. These are rates within different rank-based groups, not a statement that less popular sites collectively produce a greater volume of online sales.
The segment pattern can reflect the composition of each group as well as adoption. It does not show that a site becomes more likely to add e-commerce merely by becoming less popular; the analysis is descriptive, not a causal experiment.
When using rank comparisons, keep the rank boundary and device type in the sentence. “About one in five sites in the top-10-million group was detected as e-commerce” is meaningfully different from “one in five websites is an online store.”
How to cite the finding responsibly
Before quoting the chapter, note:
- Edition: Web Almanac 2025, published January 2026.
- Population: sites in HTTP Archive’s analyzed set, drawn from Chrome field-data coverage.
- Detection: Wappalyzer platform or strong e-commerce signals; payment processor alone is insufficient.
- Unit: percentage of sites classified, not share of sales, orders, or businesses.
- Segment: desktop/mobile and any popularity tier named in the claim.
- Limit: detection and sample coverage affect which sites are counted.
The chapter is useful for studying web implementation patterns: platform adoption, performance measurements, and differences across site segments. Its estimates should not be used to answer a national retail-sales question. Conversely, a government sales survey cannot explain what e-commerce platforms or technologies websites deploy.
A worked example
The following is hypothetical and illustrative. Imagine a marketer writing that "one in five websites is an online store," citing the Web Almanac's e-commerce chapter. Three checks tighten the claim. The first is the unit: the 19.9% desktop and 19.2% mobile figures count sites detected as e-commerce in HTTP Archive's analyzed set, not businesses, retailers, transactions, or sales. The second is the detection rule: a site is classified when Wappalyzer finds a platform or a strong commerce signal, and a payment processor alone is not enough, so the number is a detected prevalence, not a verified registry. The third is the population and segment: the site set comes from Chrome field-data coverage and skews toward visited sites, while adoption by rank runs near 1% in the top 1,000 but around 22% desktop and 21% mobile in the top 10 million. The outcome is bounded: the sentence becomes "about one in five sites in the top-10-million group was detected as e-commerce in the 2025 Web Almanac," with rank and device kept attached and no sales inference.
A counterargument
A fair critic would push back on the emphasis rather than the facts. The chapter is explicitly a study of web implementation patterns - platform adoption, performance, and differences across site segments - and for that question a detected prevalence rate is the right measure, not a flawed proxy for something else. Repeating that the figure is not a Census sales share risks treating a well-defined web metric as though it were useless, when the article itself concedes the chapter is useful for exactly this purpose.
The same detection rule that limits generalisation is also what makes the number reproducible and comparable across editions and device types.
A reader can cite the finding responsibly, with edition, population, detection, and unit attached, without needing the warning repeated at every turn.
References & Further Reading
- HTTP Archive, Ecommerce — The Web Almanac 2025, published January 15, 2026. Primary source for the 19.9% desktop / 19.2% mobile site-detection rates, rank-segment findings, Wappalyzer classification approach, and stated dataset limitations.
- U.S. Census Bureau, Quarterly Retail E-Commerce Sales: Second Quarter 2026, August 18, 2026. A distinct sales-based measure; useful for understanding why a site-prevalence estimate should not be interpreted as a share of retail dollars.