What Knowledge Graphs Actually Measures
A knowledge graph measures relationships, not just records. Read what it actually captures, a worked example, and the decisions it can and cannot support.
Teams adopt knowledge graphs expecting them to answer questions that their existing tables cannot. The surprise is that a graph does not add information by itself; it changes how existing information is connected and queried. Understanding what the structure actually measures is the difference between a useful graph and an expensive diagram that no one trusts.
Direct answer: A knowledge graph measures the relationships and semantics between entities, not the entities alone, and it is useful when the question depends on connections across sources. Wikipedia's knowledge graph entry describes the entity-relation structure, and the data modeling entry explains how such a structure is specified. Treat it as a way to encode meaning and traversal, not as a store of additional facts.
Delta: This article adds a measurement framing beyond the sources: it maps the entity-relationship and schema concepts to the specific decision of whether a graph is justified over a relational table, with claim status made explicit.
The mechanism
The central concept is the knowledge graph, which the Wikipedia entry describes as a graph of entities, their attributes, and the relationships between them, often with semantic annotations that give the links meaning. Unlike a table that fixes a row to one record type, a graph lets a node participate in many relationships at once. The practical consequence is that questions about paths and indirect connections become natural to ask. You can traverse from a person to a project to a dataset to a policy without flattening each hop into a separate join, and the shape of the answer follows the shape of the question.
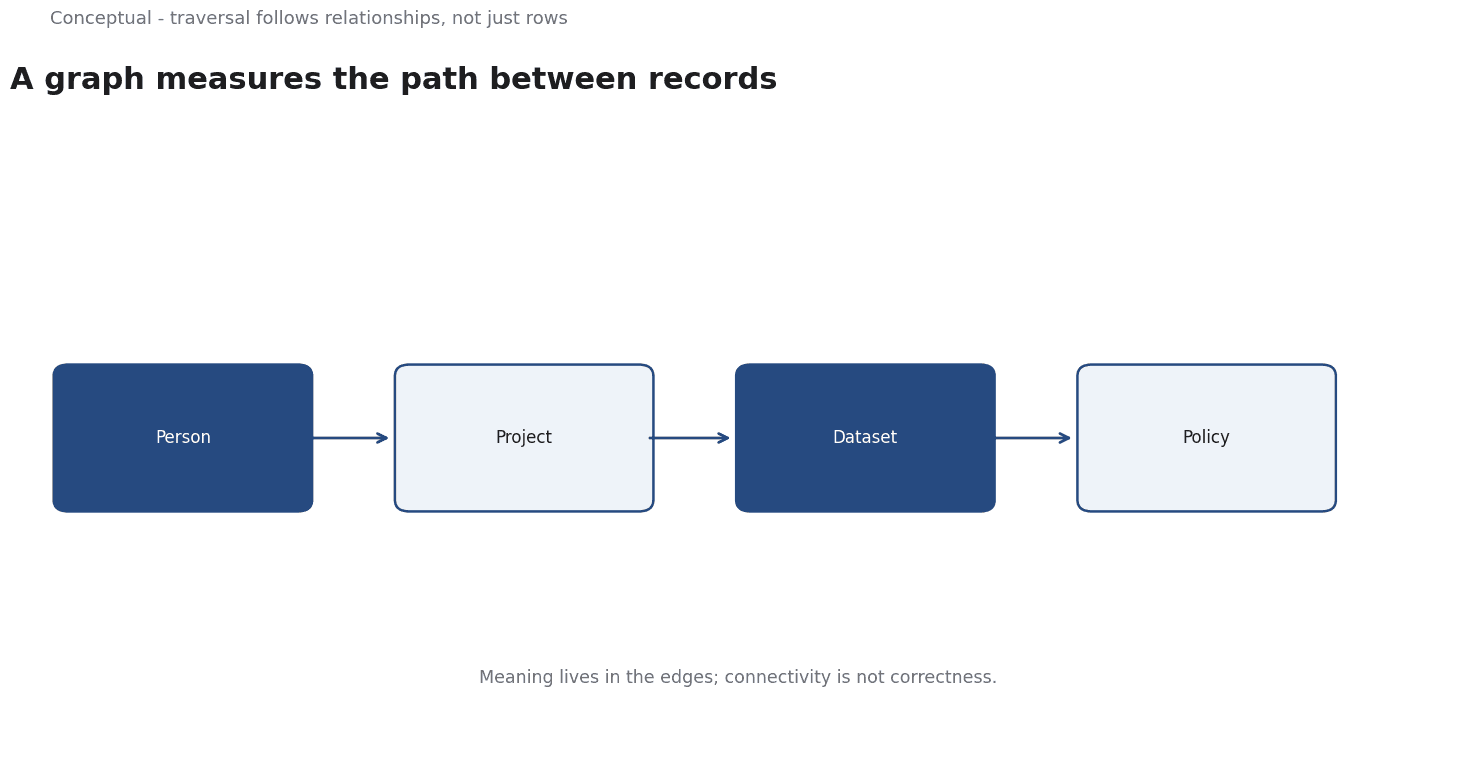
A second idea is that the meaning lives in the edges as much as in the nodes. The same pair of entities can be linked as author of, reviewer of, or dependent on, and those relations carry different implications. This is what the semantic layer of a knowledge graph captures: not just that two things are connected, but how. The practical consequence is that the quality of a graph is a quality of its vocabulary. If the relationship types are vague or inconsistent, traversal returns plausible-looking paths that do not mean what the reader assumes, and the error is hard to spot because the output still looks structured.
The third concept is data modeling, which the Wikipedia entry describes as the process of defining how data is structured, constrained, and related. A knowledge graph still needs a schema: a set of entity types, relation types, and rules about what may connect to what. The practical consequence is that a graph does not remove modeling decisions, it relocates them. The flexibility to add a new relation later is real, but it must be governed, or the structure drifts into thousands of one-off edge types that no one can query reliably. Freedom without a vocabulary is just accumulated inconsistency.
Finally, the measurement a graph provides is about connectivity, not coverage.
A graph can tell you how two records are related and how far apart they are; it cannot tell you whether the records are correct.
The mechanism therefore ends with a question for the decision: is the hard part of this problem the number of joins and the depth of traversal, or the accuracy of the underlying records? If it is the latter, a graph will not help, and the effort belongs in fixing the sources rather than in connecting them more elegantly.
A worked example
The following is hypothetical and illustrative. A research team wants to know which of its datasets are governed by a policy that also covers a partner organisation, and is considering building a knowledge graph. Three checks decide the approach. First, the connectivity test: does the question require traversing several relationship types, such as dataset to owner to project to policy, or can a single relational join answer it? Second, the semantics test: are the relationship types defined consistently enough that a traversed path means the same thing to every reader? Third, the source-quality test: are the entity records accurate and current, so that a correct path leads to a correct conclusion? The outcome is conditional. If the difficulty is genuinely the depth of traversal and the vocabulary is governed, a graph is justified. If the records themselves are unreliable or the question is a two-table join, the graph adds cost without adding an answer.
Evidence status
| Claim | Status | Source | Verified | Recheck when |
|---|---|---|---|---|
| A knowledge graph encodes entities, attributes, and relationships | source-reported | Knowledge graph - Wikipedia | 2026-11-18 | Definition or scope of the term changes |
| Data modeling defines structure, constraints, and relationships | source-reported | Data modeling - Wikipedia | 2026-11-18 | Modeling conventions or standards change |
| Graphs help most when traversal depth is the binding constraint | inferred | Derived from the sources | 2026-11-18 | New comparative evidence on graph versus relational queries |
Both structural claims come directly from the reference entries and are unlikely to change soon. The third claim is an inference about when the structure pays for itself, and it is the one to revisit. If comparative studies or internal benchmarks show that the team's questions are mostly shallow lookups, the inferred benefit shrinks and the case for a graph weakens considerably.
What it cannot do
The first limit is that a graph does not create truth. It faithfully represents whatever entities and relationships are loaded into it, including their errors. If a source system records the wrong owner for a dataset, the graph will return that wrong owner confidently and with the added authority of a connected path. The structure amplifies the input; it does not audit it. Any claim that adopting a graph improves data correctness on its own is therefore unsupported by the definitions and should be treated as a separate, measurable goal with its own checks and owner.
A hidden cost is the governance burden of the vocabulary. Every relationship type must be defined, agreed, and kept stable, and every new source introduces choices about how its concepts map into the existing scheme. This work is ongoing rather than one-off. Teams that budget for the initial build but not for the steady maintenance often end up with a graph whose edge types multiply until queries become unreliable. The cost is real and recurring, and it is easy to miss when the technology is evaluated on the promise of flexibility alone, because the flexibility is exactly what creates the maintenance.
Without a concrete set of traversal questions, there is no criterion for which relationships to model, and the result tends to mirror whatever the source systems happened to contain. Such a graph is technically valid but strategically empty. It answers the questions that were easy to encode rather than the ones that mattered, and it does so at a cost that a simpler query layer might have avoided entirely. Starting from the decision avoids this trap.
There are boundaries where a graph should not be applied. Small, stable datasets with simple, well-understood joins are better served by relational tables, which are simpler to operate and reason about. Graphs also struggle when the dominant need is aggregate analytics across millions of uniform records, where columnar stores are far more efficient. The honest boundary is that graphs excel at connected, heterogeneous, relationship-heavy questions and are a poor default for everything else. Choosing a graph without testing the question against that boundary is a structural decision made on instinct rather than evidence.
Finally, a graph needs review because its schema and its sources drift. Relationship definitions that made sense at launch can become ambiguous as the organisation changes, and source systems are replaced or renamed. The practical requirement is to schedule vocabulary reviews, to version the schema, and to track which decisions were made from which graph state. Without that discipline, users lose confidence in the paths they traverse, and a graph that once accelerated decisions becomes one people quietly bypass in favour of their own spreadsheets.
The counterargument that a graph is overkill for most teams is fair for stable, shallow, single-domain data and incomplete where questions routinely cross many heterogeneous sources, because there the traversal itself is the hard part.
A decision test
- Write down the specific questions the graph must answer.
- Identify how many relationship types and hops each question needs.
- Check whether a relational join could answer the same questions more simply.
- Define the entity and relationship vocabulary before loading data.
- Audit the accuracy and recency of the source records.
- Assign ownership for ongoing schema and vocabulary governance.
- Record which decisions rely on the graph and set a vocabulary review date.
The test is not whether a graph can be built, but whether the connections it exposes are the ones the decision depends on and whether the vocabulary behind them is governed. When those conditions hold, the structure earns its cost; when they do not, the same technology is an expensive diagram. For further reading, see Data Quality in Practice.
References & Further Reading
- Wikipedia contributors, 2026. Knowledge graph - Wikipedia — Structured representation of entities and relationships.
- Wikipedia contributors, 2026. Data modeling - Wikipedia — The structure and purpose of data models.