What INP Optimization Actually Measures
INP is a field metric for responsiveness, but a passing score can hide slow interactions. Learn what it measures, what it misses, and when a lab check matters.
Interaction to Next Paint is widely treated as a single number that certifies a site as responsive, but the number is a summary of real users rather than a property of the code. The web.dev entries on INP and Web Vitals define the metric, its thresholds, and its field-based method. The real problem is that a passing percentile can coexist with interactions that feel slow, so teams often optimize the score without finding the cause.
Direct answer: INP measures the latency from a user interaction to the next visual update, aggregated across interactions and reported as a percentile of field data. It reflects observed responsiveness on real devices and networks. A good score describes the typical experience of measured visitors, not a guarantee about any specific interaction or device.
Delta: This article adds a diagnostic framing beyond the sources: it maps the metric to the underlying interaction cost, with claim status explicit.
The mechanism
The metric times an interaction from input to the paint that follows it. The web.dev article on INP describes how it captures a broad set of interactions and reports roughly the worst or near-worst experience rather than an average, which is why a single sluggish control can move the score.
The practical consequence is that improving INP means shortening the slowest common interactions, not polishing the fastest ones.
A page that responds instantly to scrolling but stalls on add-to-cart will still be judged by the stall.
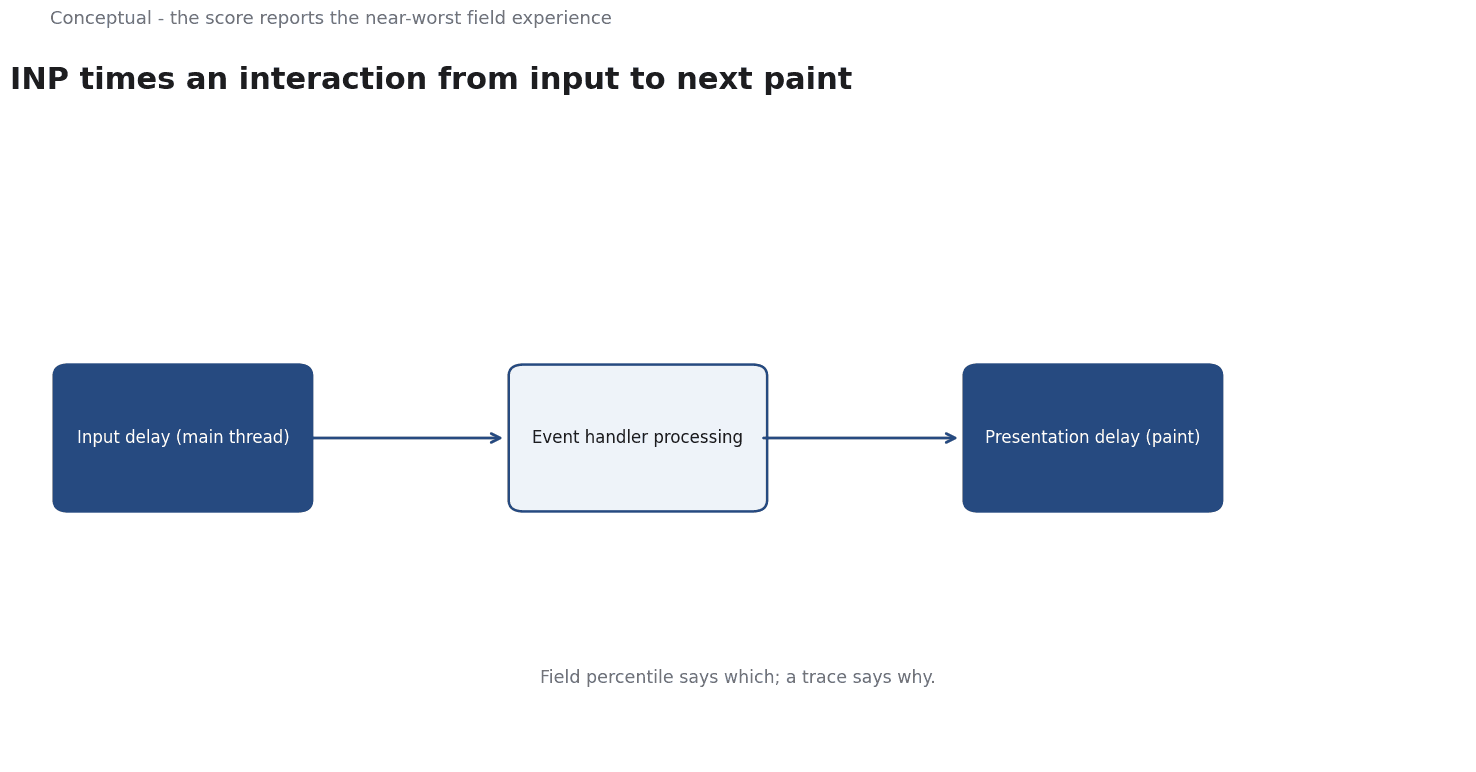
An interaction breaks into three parts: input delay while the main thread is busy, processing time in event handlers, and presentation delay before the next frame paints. Long JavaScript tasks are the usual culprit, because a task that occupies the main thread postpones both the handler and the render. The practical consequence is that the useful levers are task management and script cost, such as breaking long work into smaller pieces, deferring non-urgent code, and trimming third-party scripts. Network tuning alone rarely moves a metric whose time is spent on the main thread.
Field and lab measurement are different instruments. The Web Vitals article places INP among the Core Web Vitals and emphasizes collection from real sessions, while lab tools reproduce a single controlled load. The practical consequence is that field data tells you which interactions are slow for whom, and lab traces tell you why. Thresholds such as the good and poor bands are distributional judgments about real traffic. A passing result therefore requires enough representative traffic, and it can change as the audience, devices, or scripts change, even with no deployment.
A worked example
The following is hypothetical and illustrative. A product page reports an INP in the needs-improvement band, and a team attributes it to a slow server. Three checks decide the reading. First, does the field percentile match a lab reproduction, and on which interaction does the long delay appear? Second, what does a trace show when a shopper taps add-to-cart: input delay, handler processing, or presentation delay? Third, which script owns the long task, and is it first-party code or a third-party tag? The outcome is instructive. The server is fast, the delay is a long task in a tag, and splitting that work lowers the field score, although one rare interaction on older devices remains slow.
Evidence status
| Claim | Status | Source | Verified | Recheck when |
|---|---|---|---|---|
| INP measures latency from interaction to the next paint and is a Core Web Vital | source-reported | web.dev: INP | 2026-11-18 | Metric definition changes |
| Core Web Vitals are evaluated from field data at the 75th percentile | source-reported | web.dev: Vitals | 2026-11-18 | Thresholds or percentile method change |
| A passing INP is a distributional field result, not a per-interaction guarantee | inferred | Derived from the sources | 2026-11-18 | Measurement methodology changes |
The first two rows report definitions the sources state directly, so they carry source-reported status and a dated verification. The third row is an implication of percentile-based field measurement and stays inferred. Each row carries a recheck condition, because a revised threshold, a new metric definition, or a shift in traffic can change what the score means without a single line of application code changing.
What it cannot do
It cannot identify a cause. A score tells you that responsiveness is weak, not which handler, script, or render step produced the delay. That distinction matters because the remedies are unrelated: a long event handler, an oversized framework bundle, and a layout thrash all land in the same percentile.
The mechanism section separates input delay, processing, and presentation precisely so the investigation can start from evidence rather than from a guess about the network.
It cannot be reproduced reliably in a lab. Field data reflects real devices, connection quality, and the unpredictable order in which people interact, whereas a lab trace exercises one scripted path on one machine. A page can pass locally and fail in the field, or the reverse, because the traffic mix differs. This is why the Web Vitals framing puts real-user measurement at the center and uses lab tools as a complement. A team that optimizes only against a local run is optimizing for a visitor who does not exist, and will be surprised when the percentile fails to budge.
The percentile also hides the tail. Reporting a single high-percentile value compresses many interactions into one figure, so a page can meet the threshold while a specific action remains painful for a small group. If that action is the one tied to revenue, such as checkout, the aggregate score can be technically good and commercially unhelpful. Segmenting field data by device, route, or interaction type is the practical remedy, but it requires enough samples to be meaningful. Low-traffic pages and new features often lack the volume to support a confident read, which is a limit of the evidence rather than a flaw in the product.
Finally, the metric needs ongoing review. Third-party tags, marketing scripts, and content changes can degrade responsiveness without a code deploy, so a passing score has a shelf life. Dated observations, a named owner, and a known reversal condition keep the number honest. Chasing the score in isolation can even distort priorities, pushing a team to shave milliseconds from a measured interaction while ignoring a slower path that nobody instrumented.
The score is a signal to investigate, not a target to optimize in a vacuum.
Counterargument: the claim that a single field score captures user responsiveness is fair for a broad health check, and incomplete when one slow interaction or one device segment drives the business outcome.
A decision test
- Confirm the field percentile and the traffic period it covers.
- Segment by route, device, and interaction type to locate the slow path.
- Reproduce that path in a lab and capture a performance trace.
- Classify the delay as input, processing, or presentation cost.
- Attribute long tasks to first-party code or third-party tags.
- Apply the narrowest fix, then recheck field data rather than a local run.
- Set a review trigger tied to script and content changes.
A responsiveness score is most useful when it starts an investigation rather than ends one. Tie the number to a specific interaction, attribute the cost to a specific task, and verify the result in the field. That sequence converts a moving percentile into a decision a team can defend.
For further reading, see Marketing Dashboards.
References & Further Reading
- web.dev, 2026. Interaction to Next Paint (INP) - web.dev — Core Web Vitals metric for interaction responsiveness.
- web.dev, 2026. Web Vitals — The Core Web Vitals thresholds and what each metric measures.