What Product Content Actually Measures
Product content metrics are easy to collect and easy to misread. Read how value propositions and web analytics define the signal, and a test for measuring decisions.
Product content is usually judged by a handful of numbers: page views, time on page, and click-through rates. The real problem is that these numbers describe activity on a page, not whether the content changed anyone's understanding or decision. A team can optimize the metrics and still fail to communicate what the product does.
Direct answer: A value proposition is a statement of the benefit a product delivers and why a customer should choose it, as Wikipedia's entry frames it. Web analytics is the collection and analysis of web data such as traffic, referrals, and on-site behavior, per its Wikipedia entry. The boundary is that analytics measures behavior around content, while the value proposition is a claim whose truth must be tested, so a metric cannot by itself confirm that the claim landed.
Delta: This article adds a measurement map beyond the sources: it maps analytics signals to the value-proposition decisions they can and cannot support, with claim status explicit.
The mechanism
Wikipedia's "Value proposition" entry describes it as a statement of the benefits a product or service offers and the reason customers should prefer it. The mechanism is a claim with three parts: a benefit, an audience that receives it, and a reason to choose over alternatives. The practical consequence is that product content is the carrier of that claim. If a page does not make the benefit and the reason to choose clear, it fails at its primary job regardless of how much traffic it attracts. Content quality is therefore a question about the claim, not about the wording alone.
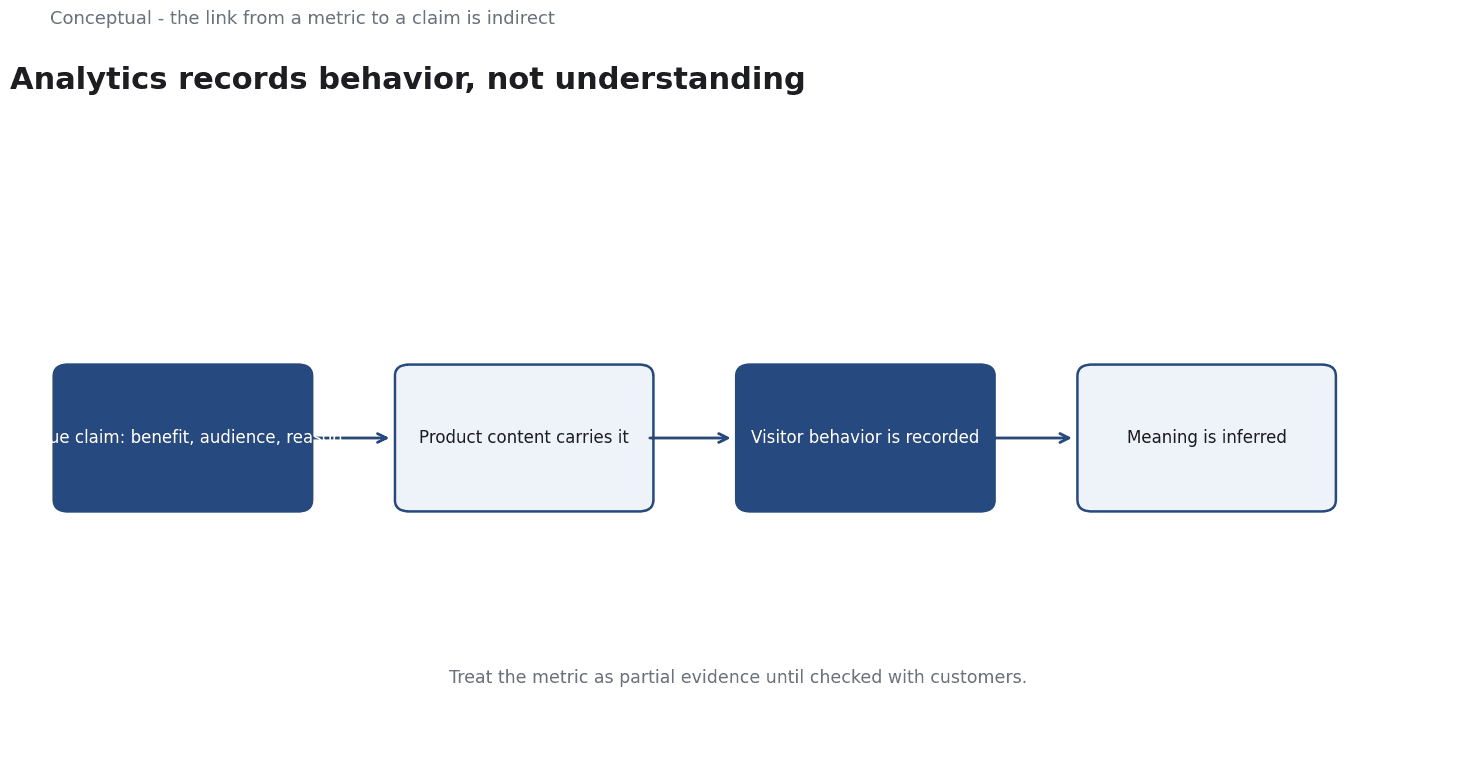
Wikipedia's "Web analytics" entry describes the collection, reporting, and analysis of web data, including traffic volume, referral sources, and visitor behavior on a site. The mechanism is an observable trace: each visit, click, and on-site action leaves a record that can be counted and segmented. The practical consequence is that analytics tells you what visitors did, not what they understood or believed. A high time on page can mean deep engagement or confusion, and both produce the same number.
The metric measures behavior, not interpretation.
The two concepts connect through a proxy relationship. Content presents the value claim, and analytics records what visitors do next; the analyst infers something about the claim from the behavior. The mechanism is indirect, and that is the crux of the measurement problem. A jump in click-through after a headline change is consistent with a clearer claim, but it is also consistent with a more curiosity-inducing headline, a change in traffic mix, or a seasonal effect. Without a stated hypothesis linking the specific metric to the specific claim, the number cannot resolve the question.
The operational consequence is that useful measurement starts by defining events around decisions rather than around pages. If the value proposition claims a concrete benefit, the relevant signals are the actions a convinced visitor would take: examining specifications, comparing plans, starting a trial, or requesting a quote. The practical consequence is a shorter, more honest dashboard. Instead of reporting every page view, the team reports a small set of events tied to the decision the content is meant to influence, and treats them as partial evidence rather than proof.
A worked example
The following is hypothetical and illustrative. A team rewrites a product page to state its value proposition more plainly and sees page views unchanged but trial starts rising. Three checks decide what this means. First, the attribution check: did the trial starts come from the rewritten page or from a concurrent campaign, which requires segmenting the referral source? Second, the claim check: does the new copy actually name a benefit and a reason to choose, or merely shorten the text? Third, the decision check: is a trial start the action a convinced visitor would take, or a low-friction click that almost anyone makes? The outcome is a bounded conclusion: the change is associated with more trial starts from that page, but the claim that the proposition landed remains a hypothesis until tested with customers.
Evidence status
| Claim | Status | Source | Verified | Recheck when |
|---|---|---|---|---|
| A value proposition states benefits and reasons to choose | source-reported | Value proposition - Wikipedia | 2026-11-18 | when the entry's definition changes |
| Web analytics records traffic, referrals, and on-site behavior | source-reported | Web analytics - Wikipedia | 2026-11-18 | when analytics scope or standard metrics change |
| Behavioral metrics are indirect evidence for a value claim | inferred | Derived from the sources | 2026-11-18 | when research links specific metrics to claim comprehension |
The first two rows report what the two entries state directly and can be checked against them. The third is an inference: it follows from treating a proposition as a claim and analytics as a record of behavior, but neither source states the link as a rule. Recheck conditions point back to the sources or to new research, which keeps the status of each row explicit rather than implied.
What it cannot do
The central limit is that web analytics cannot observe comprehension. It records that a visitor scrolled, clicked, or left; it does not record whether the value proposition was understood, believed, or found relevant. A team can therefore measure the delivery of content with precision while remaining entirely blind to its meaning. The practical consequence is that any claim about what content actually measures must be qualified: the tools measure behavior around content, and the link from behavior to understanding is an assumption that needs separate evidence.
A hidden cost is the false precision of a large dashboard. Modern analytics tools produce far more numbers than a decision can use, and the temptation is to treat the most available metric as the most important one. Page views and time on page are easy to collect but weakly connected to whether a claim persuaded anyone. The cost is measured in attention: teams spend cycles optimizing numbers that move without changing customer behavior, while the harder question of whether the proposition is true goes untested. More data can make the signal harder to see.
When a team sets a target for click-through on a call to action, the copy and layout will be tuned until the target is met, even if the clicks come from curiosity rather than intent. The metric improves while the underlying decision quality does not. The same problem appears when traffic mix shifts: a campaign that sends less-qualified visitors can raise engagement numbers and lower conversion, leaving the analyst to explain two contradictory signals from one page.
The boundary is that these tools describe behavior on a site, not the truth of the value proposition. A product page can be clear, well-trafficked, and associated with many conversions, and still make a promise the product does not keep. Neither source claims that analytics validates a claim; the value-proposition entry presents the proposition as a statement to be tested with customers, and the analytics entry describes measurement of web behavior. Treating a metric as proof of the claim crosses that boundary and produces confident but unfounded conclusions.
Because the signals are indirect, measurement needs scheduled review. Tracking implementations change, referral sources shift, and page designs alter what a metric even means. A definition of a conversion event that was meaningful last quarter may now count a different action. The practical requirement is to keep a short set of decision-linked events, document what each one is intended to indicate, and revisit the mapping when the site, the traffic, or the proposition changes. Without that discipline, a dashboard becomes a record of habits rather than evidence about decisions.
The counterargument that behavioral data is the only scalable signal is fair for detecting patterns across many visitors and incomplete for explaining why a value proposition persuades a specific customer.
A decision test
- Write the value proposition as a claim with a benefit, audience, and reason to choose.
- Name the decision the content is meant to influence.
- Choose events that a convinced visitor would perform, not just page views.
- State a hypothesis linking each chosen metric to the claim.
- Segment the data by referral source to separate content from campaign effects.
- Treat the metric as partial evidence and plan a direct check with customers.
- Review the event definitions when the page, traffic, or proposition changes.
These steps turn a vague goal about measuring product content into a short, explicit chain from claim to signal to decision. The mapping from analytics behavior to value-proposition claims is what keeps the dashboard honest about what it can show. A passed test does not prove the proposition true, but it makes clear which assumption each number is meant to test and where direct customer evidence is still needed.
For further reading, see What AI Search Actually Measures.
References & Further Reading
- Wikipedia contributors, 2026. Value proposition - Wikipedia — The value a product promises to a buyer.
- Wikipedia contributors, 2026. Web analytics - Wikipedia — Collection and interpretation of website behaviour data.