What Remote Work Actually Measures
Remote-work dashboards track logins, response times, and online hours. Learn what those signals record, what they omit, and how to turn them into defensible decisions.
Remote work is often judged with numbers borrowed from office habit and web analytics: hours online, message response times, login counts, tickets closed. These figures are cheap to collect and look objective, so they get treated as proof of productivity. The problem is that a signal can be measured correctly while still describing activity rather than the work a team was hired to do.
Direct answer:
Most remote-work metrics record observable digital traces: that a person connected, replied, or completed a tracked action.
They do not directly measure judgment, collaboration quality, or the value of the output. Used as bounded signals with their limits attached, they can inform a decision; treated as productivity scores, they mislead.
Delta: This article adds a measurement-first reading beyond the two sources: it maps each observable remote-work signal to a specific management decision, with claim status made explicit rather than assumed.
The mechanism
The Wikipedia entry on remote work describes an arrangement in which people work outside a traditional office, relying on communication technology to do their jobs. That definition matters for measurement because moving work out of a shared physical space changes what is visible to a manager. Presence, effort, and interaction no longer happen in front of an observer. They happen inside tools that leave logs. The practical consequence is that the organization sees the digital residue of work rather than the work itself, and the residue is easier to count than the substance.
The Wikipedia entry on web analytics defines the field as the measurement, collection, and analysis of web usage data, with common figures such as page views, sessions, unique visitors, and conversion events. Its own caveats are instructive: a count records an event, not the intent or quality behind it, and the numbers are shaped by tracking choices, cookies, bots, and definitions. Remote-work telemetry behaves the same way. A login is an authentication event, an online status is a connection state, and a response time is a gap between two timestamps. Each is a real observation, and none is a direct reading of contribution.
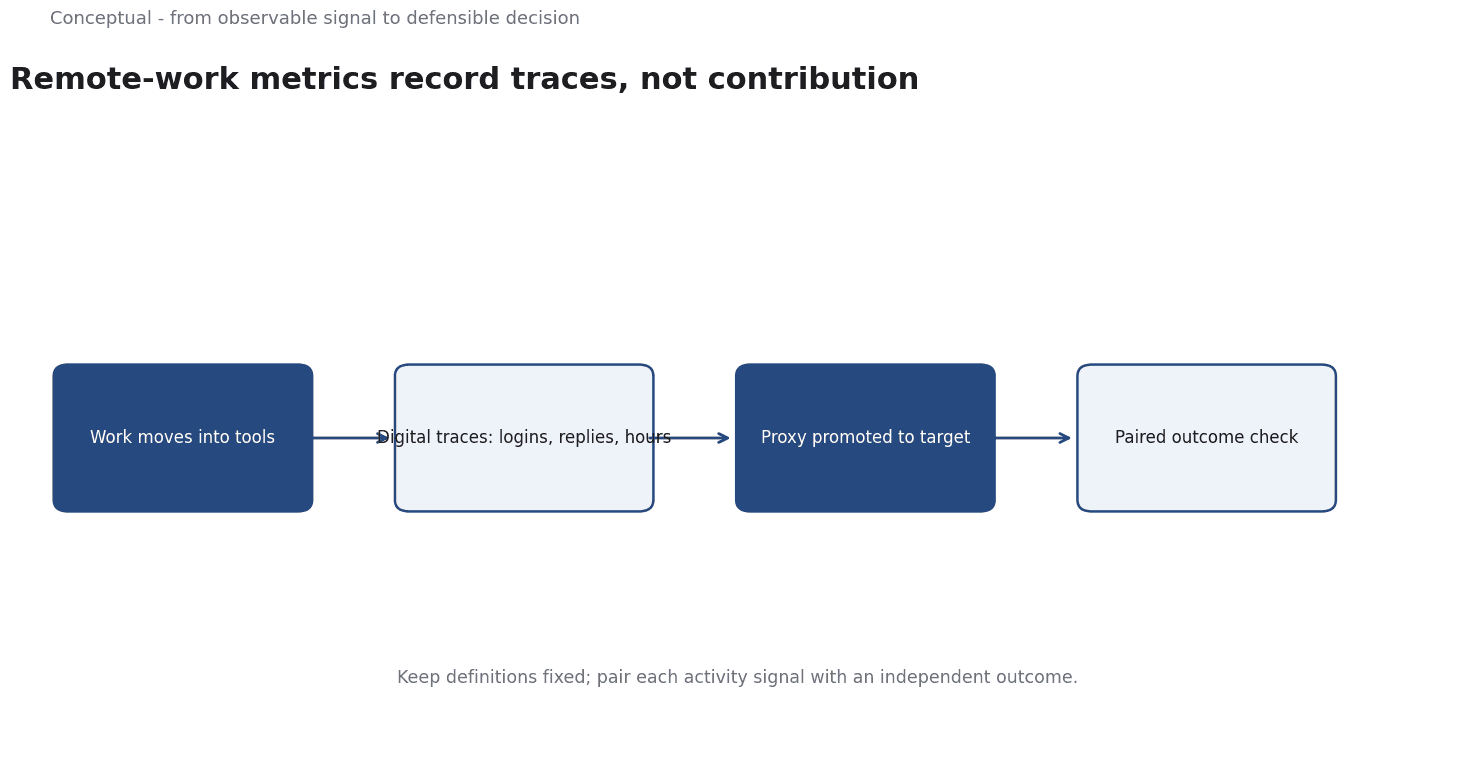
When the thing that matters is hard to observe, organizations substitute a proxy that is easy to observe. That substitution is reasonable until the proxy is promoted into a target, at which point attention shifts to improving the number rather than the underlying goal. A response-time target, for example, can be met by quick acknowledgements that carry no resolution. A tracked-hours target can be met by staying connected while doing little of value. The failure is not in the metric but in treating a partial indicator as a complete one.
The practical consequence is a discipline of use. Keep definitions and measurement windows fixed so that a change in the number means a change in the thing measured, not a change in the ruler. Pair each activity signal with an outcome check that is independent of the telemetry. Label interpretations as directional rather than conclusive. When these habits hold, remote-work signals become useful inputs to decisions about staffing, process, and support; when they do not, the numbers become a poorly disguised judgement of people.
A worked example
The following is hypothetical and illustrative. A distributed support team is reviewed with a dashboard showing that average response times fell and that online hours rose over one quarter. A manager is considering whether to expand the team's remote arrangement based on those two moves.
Three checks decide what may be said. First, are the definitions and the time window fixed, or did the tracking rules and ticket mix change between periods? A different basis makes the comparison meaningless. Second, is there an outcome signal independent of the dashboard, such as follow-up contacts or resolution quality? Without it, faster replies may simply be faster acknowledgements. Third, is there a plausible confound, such as a staffing change or a shift in the kinds of tickets arriving? Either could move both numbers at once.
The outcome is narrow. The signals support a claim that responsiveness, as recorded by the tool, improved under the current setup. They do not support a verdict that the team became more productive or that remote work caused the change. The decision is recorded with that limit and a date to revisit it.
Evidence status
| Claim | Status | Source | Verified | Recheck when |
|---|---|---|---|---|
| Remote work is work done outside a traditional office using communication technology. | source-reported | Wikipedia, Remote work | 2026-11-18 | The working arrangement or its terminology changes. |
| Web analytics measures and analyzes usage data such as page views and sessions. | source-reported | Wikipedia, Web analytics | 2026-11-18 | Standard metric definitions or tracking methods change. |
| Remote-work activity telemetry records digital traces rather than the value of output. | inferred | Derived from the sources | 2026-11-18 | A validated direct measure of output is introduced. |
The first two rows restate what the sources describe; the third is a reasoned inference, not a quoted statement. The status labels mark the difference so a reader knows which claims are reported and which are argued. The recheck column tells a reviewer when each row goes stale, which matters because both definitions and tooling change over time.
What it cannot do
Remote-work metrics cannot measure the value of the work. They record that an action happened, not whether the action was sound, timely in the right way, or useful to anyone. Two people can show identical activity traces while producing very different results, because judgement, prioritization, and the quality of collaboration leave no reliable trace in a login log or a response timer. Any claim that a number proves contribution is a claim the data cannot support.
They carry a hidden cost. Measuring a distributed team closely can read as surveillance, which erodes trust and changes behaviour in ways that degrade the very thing being measured. There is also an overhead cost: defining, collecting, cleaning, and explaining a metric takes time from the people who would otherwise be doing the work. A team may end up maintaining a measurement apparatus whose cost exceeds the value of the decisions it informs, especially when the metric is reported out of habit rather than used.
Once a number is tied to evaluation, people optimize for it, and the link between the number and the real goal weakens. Bad definitions create a related failure: if the tracking rules shift, a stable number may conceal a changed reality, or a changed number may reflect only a new ruler. Automated collection adds its own noise, since connection states and timestamps can be distorted by client behaviour, background processes, and simple errors.
The boundary is equally important. These signals apply to digital activity and are largely blind to offline work, deep thinking, mentoring, and the informal help that holds a team together. Comparisons across people or teams are unreliable when baselines differ, because roles produce different digital footprints. A metric designed for one function can be actively misleading when applied to another, and a rise in a signal can reflect a change in work mix rather than a change in effort.
Finally, the system needs review. Definitions drift, tools are updated, and the work itself changes, so a metric that was once informative can quietly become obsolete. A responsible use keeps claim status explicit, records the limits alongside the number, and sets a date to recheck the definitions. Without that review, a dashboard that once supported good decisions becomes a source of confident but stale claims.
The counterargument that activity metrics are useful is fair for tracking responsiveness and incomplete for judging contribution or quality.
A decision test
- State the decision the metric is meant to inform before looking at the number.
- Name exactly what the signal records, using the tool's own definition.
- Confirm that definitions, windows, and tracking rules are fixed across the comparison.
- Pair the activity signal with an outcome check that is independent of the telemetry.
- Look for confounds, such as staffing, work mix, or tool changes, that could explain the movement.
- Label the interpretation as directional and never present it as a productivity score.
- Record the decision with its limits and a date to recheck the definitions.
These steps do not make a weak signal strong. They keep a genuinely useful signal from being over-read. The point is not to collect more numbers but to attach to each number a clear account of what it is and is not evidence for, so that a decision can be defended later. Where the signal cannot carry the claim, the honest result is to seek a different measure rather than to stretch the current one.
For further reading, see Data Governance: Managing Data as an Asset.
References & Further Reading
- Wikipedia contributors, 2026. Remote work - Wikipedia — Distributed and asynchronous ways of working.
- Wikipedia contributors, 2026. Web analytics - Wikipedia — Collection and interpretation of website behaviour data.