What Risk-Adjusted Returns Actually Measures
A Sharpe ratio compares return to variability, not to danger. Read what it captures, a worked example, and where it misleads.
A high return is not impressive if it came with wild swings, which is why risk-adjusted measures exist. The Sharpe ratio is the best known: excess return divided by the standard deviation of returns. It is useful and frequently over-interpreted, because variability is only one meaning of risk.
Direct answer:
The Sharpe ratio measures return per unit of return volatility, using a risk-free rate as the reference.
Wikipedia's Sharpe ratio entry provides the definition, and FRED supplies dated risk-free series. The boundary: volatility is not the same as the risk of permanent loss, which the financial-crises article treats as a question of tail events, and a smooth series can hide large hidden risks, as the earnings-quality article warns about numbers that look clean.
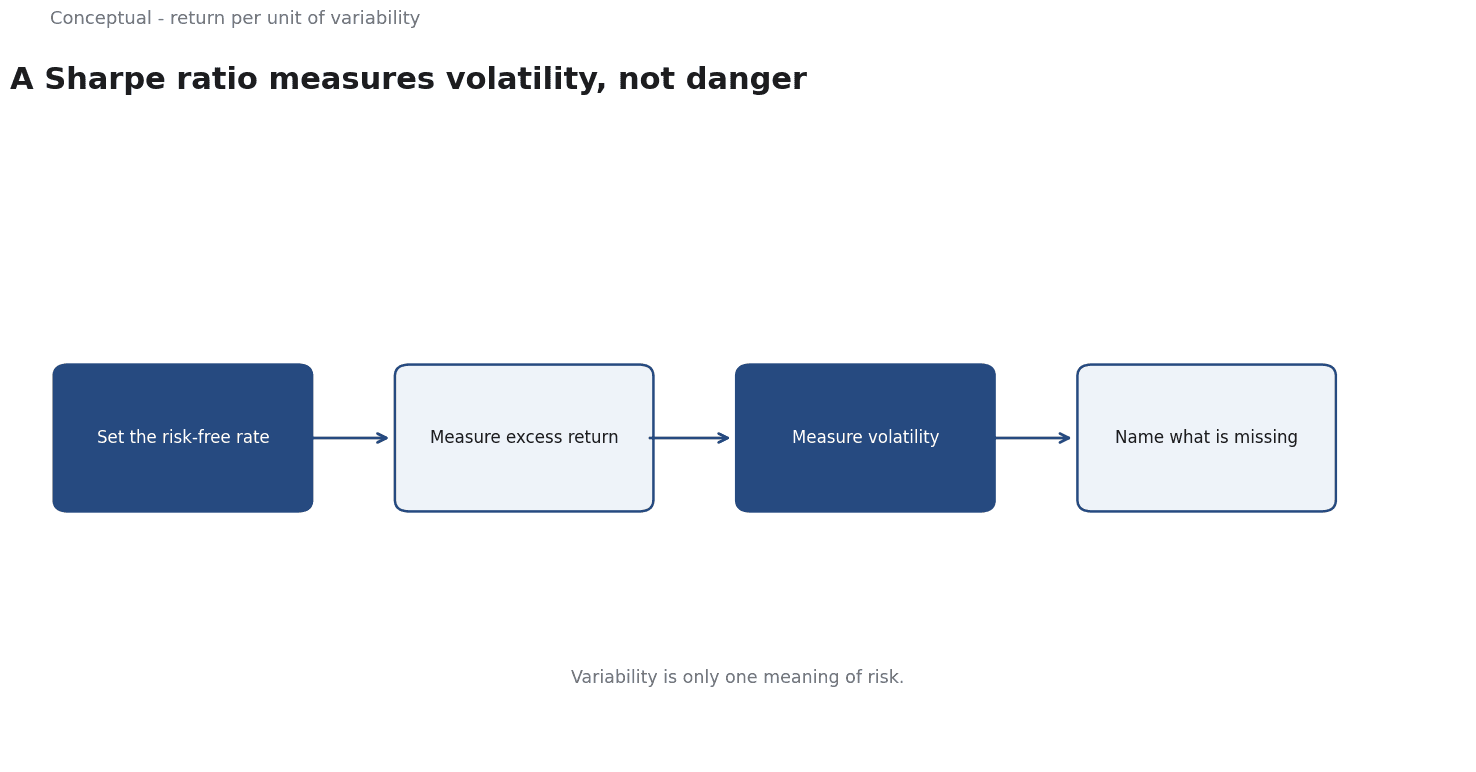
The reference rate matters
The numerator of the Sharpe ratio is excess return, so the choice of risk-free rate changes the answer. A rate that does not match the period or currency produces a misleading excess, which the real-interest-rates article explains for basis consistency, as the FRED series with dated releases supports a defensible choice. Two funds measured against different reference rates cannot be compared fairly, which the benchmarks article requires for comparable conditions.
The denominator is equally sensitive. Volatility estimated over a calm period understates the variability that appears in a crisis, which the financial-crises article treats as a regime-change problem, as the monitoring article warns about measures that drift with the window. A ratio computed over a single year is a description of that year, which the evaluation-rubric article treats as a limited claim, not a property of the fund.
For these reasons, the measure is best reported with its inputs — the period, the reference rate, and the return basis — as the data-governance article requires for relied-upon figures, as the decision-memo article requires for recorded judgement.
What it captures
Excess return. The return above a risk-free rate, which is the compensation for taking risk, as the definition states. The reference rate should match the period and currency, which FRED's dated series supports, as the real-interest-rates article explains for basis consistency.
Volatility. The standard deviation of returns, which measures how much outcomes varied, not how often they were bad, as the Sharpe ratio definition makes clear. A strategy with frequent small gains and rare large losses can have an attractive ratio, which the financial-crises article treats as a tail-risk problem.
A relative score. The ratio is useful for comparing strategies measured the same way over the same period, which the benchmarks article argues for comparable conditions, as the factor-investing article treats return differences as context-dependent.
Three consequences follow. The period matters, because volatility estimates change with the window, which the monitoring article treats as a measurement choice. The basis matters, as real and nominal rates differ, which the real-interest-rates article explains. And the ratio should be read alongside drawdown and tail behaviour, as the financial-crises article advises for severe outcomes.
A worked example
The following is hypothetical and illustrative. Fund A returns 10% a year with 10% volatility; Fund B returns 14% with 20% volatility. The risk-free rate is 3%.
Fund A's ratio is (10−3)/10 = 0.7. Fund B's is (14−3)/20 = 0.55. On this measure Fund A is better, even though Fund B earned more, which the definition explains. Three checks decide whether to trust it. First, are the returns from the same period and basis, as the benchmarks article requires? Second, what is the worst drawdown of each, which the financial-crises article treats as a tail measure? Third, are the returns smooth in a way that hides illiquidity or valuation smoothing, as the earnings-quality article warns about clean-looking numbers?
Three conclusions follow. The ratio is a comparison of variability, not safety, as the definition states. A low-volatility fund can still suffer a permanent loss, which the financial-crises article treats as a mechanism question. And the decision should be recorded with the limitations, as the decision-memo article requires.
What the measure cannot do
It cannot predict future returns, which investor education states explicitly. It cannot capture all risk, which the financial-crises article treats as a problem of tails and contagion. And it does not adjust for liquidity or leverage, which the derivatives article explains for how exposure is created, as the risk-assessment article treats exposure as a separate decision.
The counterargument that a higher ratio is always better is wrong when the volatility measure misses the risk that matters, which the worked example illustrates for rare losses, as the earnings-quality article warns about clean figures.
A decision test
- Check the period, currency, and basis, as the real-interest-rates article requires.
- Compute the ratio with a dated risk-free rate from FRED.
- Read it alongside drawdown and tail behaviour, as the financial-crises article advises.
- Compare only strategies measured the same way, as the benchmarks article requires.
- Check for hidden risk in smooth returns, as the earnings-quality article warns.
- Record the decision with the limitations, as the decision-memo article requires.
- Re-measure after a material change, as the monitoring article advises.
For the broader context, see Portfolio Rebalancing; for the data, see FRED.
References & Further Reading
- Wikipedia contributors, 2026. Sharpe ratio - Wikipedia — The definition of risk-adjusted return and its computation using excess return and standard deviation.
- Federal Reserve Bank of St. Louis, 2026. FRED economic data — The primary time-series database used for macro indicators.