A/B Testing Recommendation Systems: Measuring Lift Without Bias
Recommender experiments are unusually easy to get wrong. Read the biases, the interference, and the design choices that make lift measurable.
Testing a recommender is not like testing a button colour, and treating it as such is how teams end up with a metric that improved while users were worse off. The system chooses what people see, which means the experiment changes the thing being measured, and the customers in the two groups are not independent of each other in the usual way.
Direct answer: Three properties make this hard: position bias — users click what is shown near the top regardless of relevance; interference — one user's behaviour helps train the model that serves another; and delayed feedback — a good recommendation today changes what a user buys next month. The practical answer combines user-level randomisation, delayed measurement, and variance reduction such as CUPED.
The lift from a recommender change has to be measured against an unbiased assignment, over a horizon long enough to include the feedback loop, with a metric tied to value rather than to clicks.
Why position bias poisons a naive test
A recommender ranks items, and rank itself drives clicks. Users scan from the top, so an item in position one gets more clicks than the same item in position ten even when their preferences are unchanged.
The consequence for experimentation is that if the new model changes the ordering, a click-through-rate improvement may reflect nothing more than a different distribution of positions. This is not a nuisance that a larger sample removes — the bias is in the metric, not in its variance.
The two standard responses are to randomise the position of items being evaluated — interleaving, where two ranking systems are blended into one list and compared at the item level — or to log the position explicitly and adjust for it in the analysis. Both are designs you have to choose before the test; neither can be reconstructed afterwards from a click log that omitted the position.
Interference and the feedback loop
In an ordinary A/B test, we assume one user's treatment does not affect another's outcome. A recommender breaks that assumption in two ways.
First, the model is trained on the behaviour of everyone, so the control group's clicks influence what the treatment group is shown. Second, the items themselves compete: a recommendation that promotes one product suppresses another, and the effect on the suppressed item is a real business outcome that does not appear in the treated user's session.
The implication is that the unit of analysis matters. User-level randomisation is a start; geo-level or time-based designs are sometimes required when the intervention changes the catalogue, the ranking policy, or the supply of recommendations. Google's published work on geo experiments notes that "one approach that Google has successfully employed to measure advertising effectiveness is geo experiments" and that the approach has "a systematic and effective design process" — the same motivation applies when a recommender change operates at market level.
The metric has to survive the feedback loop
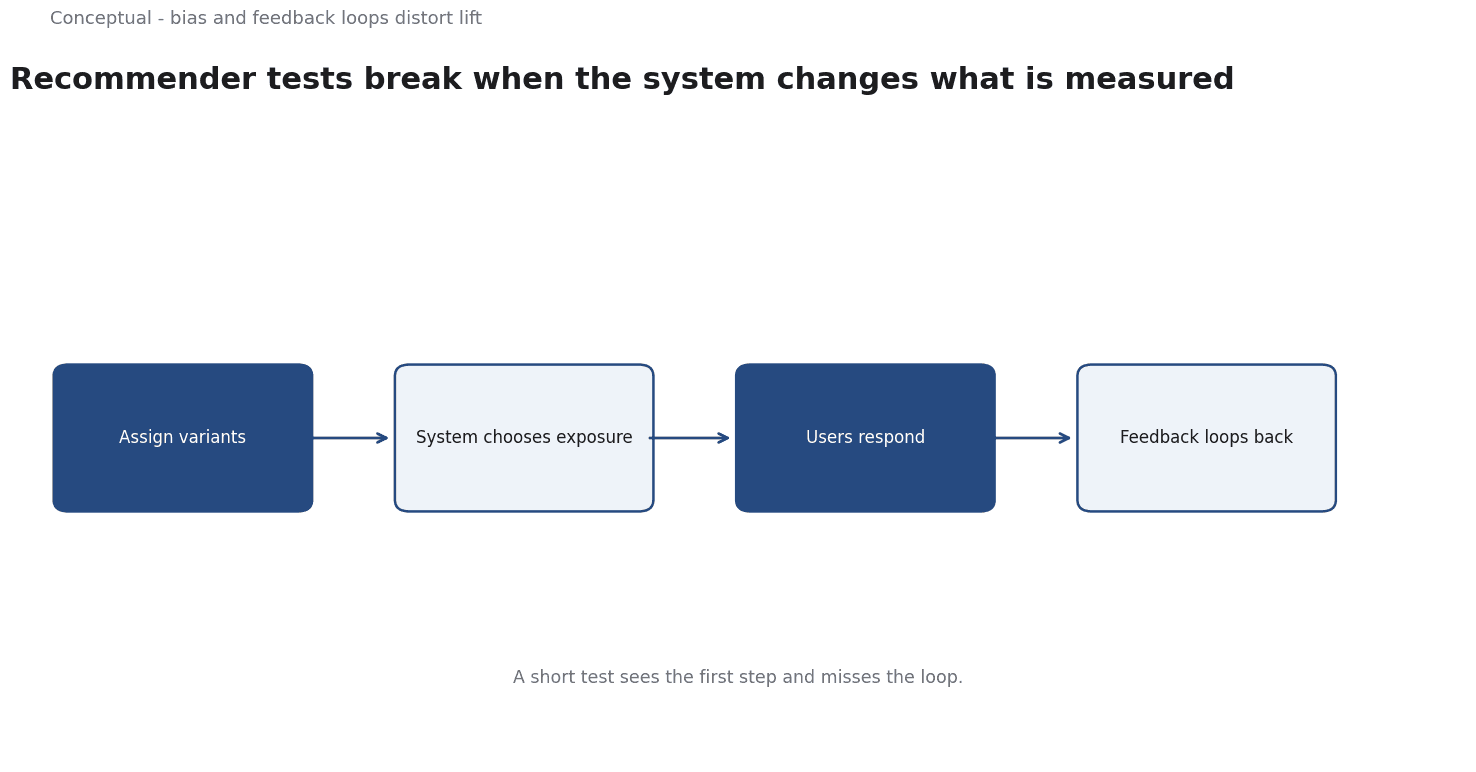
Recommenders operate over time: what you show a user changes what they click, which changes what you show them next.
This is why the primary metric in a recommender test should be something that survives the horizon — retained usage, repeat purchase, total value over a defined window — rather than immediate click-through. CTR is a diagnostic, not an objective. A model that optimises for it can win the test and degrade the experience by surfacing sensational items that are clicked once and never returned to.
The ranking objective itself matters here. DeepFM's work on click-through prediction argues that "learning sophisticated feature interactions behind user behaviours is critical in maximizing CTR" and describes an end-to-end model that "emphasizes both low- and high-order feature interactions". Richer interaction modelling can genuinely improve ranking — but note the objective in that sentence is CTR, which is exactly why a test needs a second metric that the ranking model was not trained to optimise.
Sensitivity is still the constraint
Recommender metrics are noisy, and user-level variance is high. CUPED is described as using "data from the pre-experiment period to reduce metric variability and hence achieve better sensitivity", and the reported Bing result is about a 50% reduction in variance — "the same statistical power with only half of the users, or half the duration".
For a recommender test, this is unusually valuable, because the pre-period behaviour is a strong predictor of the post-period behaviour, and the same users are typically available. The practical consequence is that a recommender team should treat the pre-period data as a first-class asset and design the logging to support it, rather than treat variance reduction as an analysis-time trick.
A test design that holds up
- Decide the objective before the model. If the business wants repeat purchase, a CTR win is a diagnostic, not a result.
- Log position and candidate set, not just what was clicked. Without them, position bias cannot be diagnosed.
- Use interleaving or another position-controlled design when evaluating ranking changes.
- Randomise at a unit that matches the intervention — user for interface changes, geo or time for catalogue-wide changes.
- Measure over a horizon long enough to include the feedback loop, and keep the same horizon for control and treatment.
- Use pre-period covariates for variance reduction where the data exists, and fix the analysis before launch.
- Track the suppressed items and segments, because a recommender's gains are often a transfer between items rather than a net gain.
For the recommendation mechanics being tested, see Recommender Systems; for the general experiment design, see A/B Testing.
A worked example
The following is hypothetical and illustrative. A hypothetical online shop with 20,000 weekly visitors tests a new ranking model that reshuffles its product grid. The team picks repeat purchase over 30 days as the objective, not click-through. Three checks decide the test. First, was position and the candidate set logged? Without them, a click lift from items moving to the top cannot be separated from a genuine preference shift, so the design uses interleaving. Second, is the horizon long enough to include the feedback loop? A one-week read would miss what a good recommendation changes next month, so both arms run for 30 days. Third, is the randomisation unit matched to the intervention? A catalogue-wide change raises interference, so a geo-level design (Vaver and Koehler) is considered alongside user-level assignment, with CUPED applied to pre-period spend. The outcome is bounded: if repeat purchase does not rise and suppressed items lose share, the change is withheld, and any credit to a single touch is treated as model-dependent (Google Ads Help).
A counterargument
For all its design discipline, the argument overstates how far instrumentation can stabilise a recommender test. CUPED's reported 50 percent cut rests on pre-period behaviour predicting post-period behaviour, yet a recommender deliberately reshapes that behaviour, so the covariate the method leans on may be the very thing the treatment changes - and the result was demonstrated on Bing, not on a ranking system with this feedback structure. The article also treats user-level randomisation as a default while conceding that the model retrains on everyone's clicks; when the intervention changes the catalogue, the geo designs of Vaver and Koehler buy feasibility at the cost of the precision the article wants. Calling CTR a diagnostic rather than an objective sidesteps the attribution limits the Google Ads help documentation itself records: the long-horizon value metric is no less model-dependent, only slower to read.
The framing presents a stabilising design as a neutral one.
References & Further Reading
- Kohavi, Tang, and Xu, 2013. CUPED — ExP Platform — Using pre-experiment data to reduce metric variability; the Bing result cut variance by about 50 percent, giving the same power with half the users or half the duration.
- Brian Vaver and Koehler, 2011. Measuring Ad Effectiveness Using Geo Experiments — Geo experiments for incrementality, the cleanest way to attribute marketing spend.
- Google Ads Help, 2026. About attribution models - Google Ads Help — First-party documentation of attribution models and their limits.