A/B Testing: Making Decisions with Experiments
An A/B test is a decision instrument with a failure mode. Read how variability, power, and stopping rules determine whether it is trustworthy.
The most common way organisations use A/B tests is also the least reliable: launch a change, wait until a number looks favourable, and ship. That is not experimentation, and it is not an opinion about a lack of rigour — it is a description of a specific statistical failure that produces false wins at a predictable rate.
Direct answer: The most useful practical finding in the field is that you do not need more traffic to get more sensitivity: CUPED uses data from the pre-experiment period to reduce metric variability, and the reported Bing result is "reduce variance by about 50%, effectively achieving the same statistical power with only half of the users, or half the duration". That result reframes the whole conversation from "how long do we run it" to "how much noise are we carrying".
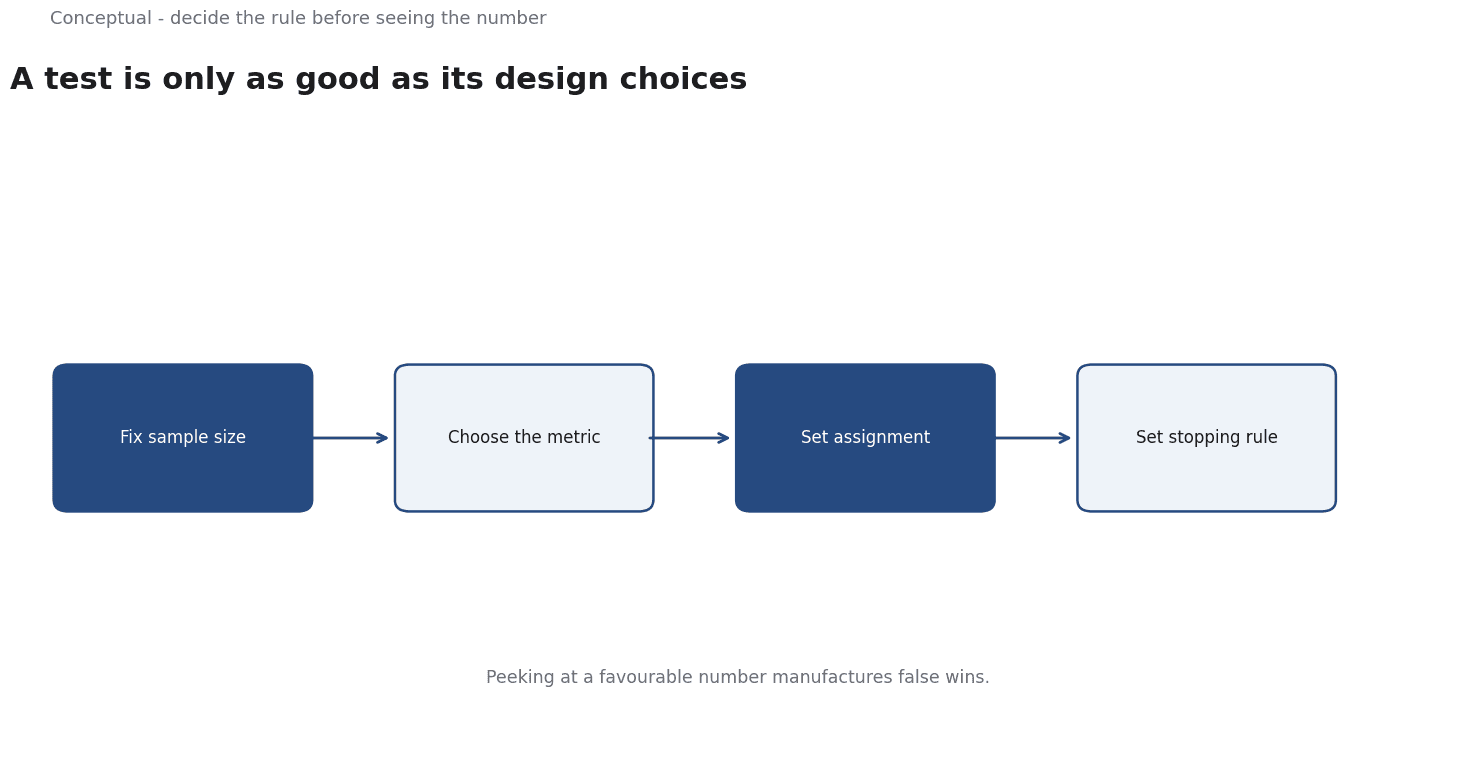
An A/B test is a decision instrument whose output is a noisy estimate, and its value depends entirely on design choices made before it runs — the sample size, the metric, the assignment, and the stopping rule.
The failure mode is variance, not traffic
Teams usually explain inconclusive tests by blaming traffic. They ran for two weeks and nothing moved, so they need a bigger test or a bigger effect. Often the real problem is that the metric was noisy: the same user's behaviour varies wildly day to day, and the treatment effect is a small signal on top of that.
CUPED addresses this directly. The method is described as using "data from the pre-experiment period to reduce metric variability and hence achieve better sensitivity". In plain terms: if a user's behaviour before the experiment predicts their behaviour during it, you can adjust for the pre-period value and remove the predictable part of the variation. What remains is the part the experiment can actually detect.
The reported magnitude is the point. A 50% reduction in variance means doubling the effective sensitivity without doubling the sample — the same power with half the users or half the duration. For any team whose answer to "we cannot detect small effects" is "we need more traffic", this is the first thing to check.
It also carries a condition: the pre-experiment data must exist and must be joined to the same users. An organisation that did not instrument the pre-period cannot use the method retroactively, which is one of many reasons instrumentation is a strategic decision rather than a reporting detail.
Design the decision before the metric
The most important question in an experiment is not which statistical test to run. It is what decision will follow from each possible result, and what outcome would change your mind.
This is where most programmes quietly fail. A team launches an experiment, the result comes back, and the organisation discovers it had not agreed on what a win looked like.
The practical discipline is to write four things before launch:
- The primary metric and the direction of improvement.
- The minimum detectable effect — the smallest change that would be worth shipping, given the cost and the risk.
- The sample size and duration implied by that effect, at an agreed confidence level.
- The decision rule — what happens if the result is positive, negative, or inconclusive.
The last item is the one teams skip, and it is the one that makes experiments useful.
The geo alternative when you cannot randomise users
Not every question can be answered by assigning individual users to variants — pricing changes by market, brand campaigns, and distribution changes often cannot be randomised at the user level.
Google's published work on geo experiments offers the alternative: "One approach that Google has successfully employed to measure advertising effectiveness is geo experiments." The paper "describes the application of geo experiments and demonstrates that they are conceptually simple, have a systematic and effective design process, and provide results that are easy to interpret."
The trade-off is specific. You trade the precision of individual randomisation for the feasibility of a randomised design at the level where the intervention actually applies — and you accept that a small number of geographies gives you a much larger variance, which brings you back to the power problem. The same principles apply: design the comparison before you run it, and size the test against the effect you need to detect.
What to do on Monday
- Check whether your metric has pre-experiment data. If it does, look at variance reduction before you buy more traffic.
- Write the decision rule before the test starts, including what you will do with an inconclusive result.
- State the smallest effect worth shipping. This is a business judgement, not a statistical output.
- Fix the sample size and duration in advance, and report when they changed.
- Do not stop when the number looks good. Repeated peeking at a noisy metric manufactures false positives; if you need to monitor, use a method designed for it.
- Keep a record of every test, including the failures. An archive with only wins is evidence of a process problem, not of a successful experimentation culture.
For the recommender-specific version of this, see A/B Testing Recommendation Systems; for the attribution question underneath marketing experiments, see Marketing Attribution.
A worked example
The following is hypothetical and illustrative. A hypothetical checkout tool with 50,000 weekly sessions considers moving its primary button. The team suspects the conversion metric is noisy rather than the traffic too small. Three checks frame the test. First, does pre-experiment data exist for the same users? If so, CUPED can adjust for the pre-period value and cut variance, as the reported Bing result suggests, rather than buying more traffic. Second, what decision follows from each result? Before launch the team writes the primary metric, the smallest effect worth shipping, the sample size and duration, and the rule for a positive, negative, or inconclusive read. Third, can the team resist peeking? A stopping rule is agreed in advance, with monitoring only through a method designed for repeated looks. The outcome is bounded: if the adjusted test cannot resolve the minimum detectable effect within the fixed duration, the result is logged as inconclusive and the button stays, with the archive keeping the failure alongside any wins.
For an applied comparison where a learned model is judged against a zero-parameter rule with paired McNemar tests and Holm correction, see the BTC Monthly ML case study.
A counterargument
The confidence in variance reduction is fair but narrower than the opening suggests. CUPED's 50 percent cut assumes the pre-period covariate exists, is stable, and can be joined to the same users - conditions the article names but treats as an instrumentation detail rather than a structural limit. For an organisation that never logged the pre-period, or where the change alters behaviour before the test starts, the method cannot be retrofitted, and the constraint is data the company does not have rather than traffic. The claim that more traffic is unnecessary also overreaches: a bounded variance reduction still leaves genuinely small effects undetectable, and the geo alternative the article itself offers trades away precision because a small number of geographies carries much larger variance (Vaver and Koehler). A critic would say the real failure mode is a metric that does not capture the decision - which the next section concedes - making the opening framing incomplete rather than wrong.
References & Further Reading
- Kohavi, Tang, and Xu, 2013. CUPED — ExP Platform — Using pre-experiment data to reduce metric variability; the Bing result cut variance by about 50 percent, giving the same power with half the users or half the duration.
- Brian Vaver and Koehler, 2011. Measuring Ad Effectiveness Using Geo Experiments — Geo experiments for incrementality, the cleanest way to attribute marketing spend.