AI for Data Analysis: From Question to Verified Answer
Natural-language analytics is useful only when the number can be checked. Read the four stages and a worked verification example.
An analyst asking "what was our churn last quarter?" in plain language and receiving a chart feels like progress. The danger is that the answer is a number computed by a model with a plausible-looking query behind it, and nobody checked the definition of churn or the denominator. The value of natural-language analytics depends entirely on verification.
Direct answer: AI data analysis works as a four-stage pipeline — interpret the question, generate a query, execute it against a defined source, and verify the result before presenting it. Anthropic's use-case guides cover analysis patterns, and the financial-statement overview illustrates why definitions and denominators matter. The boundary: a fluent answer is not a correct one, and the model's confidence is not evidence — the verification layer is the control.
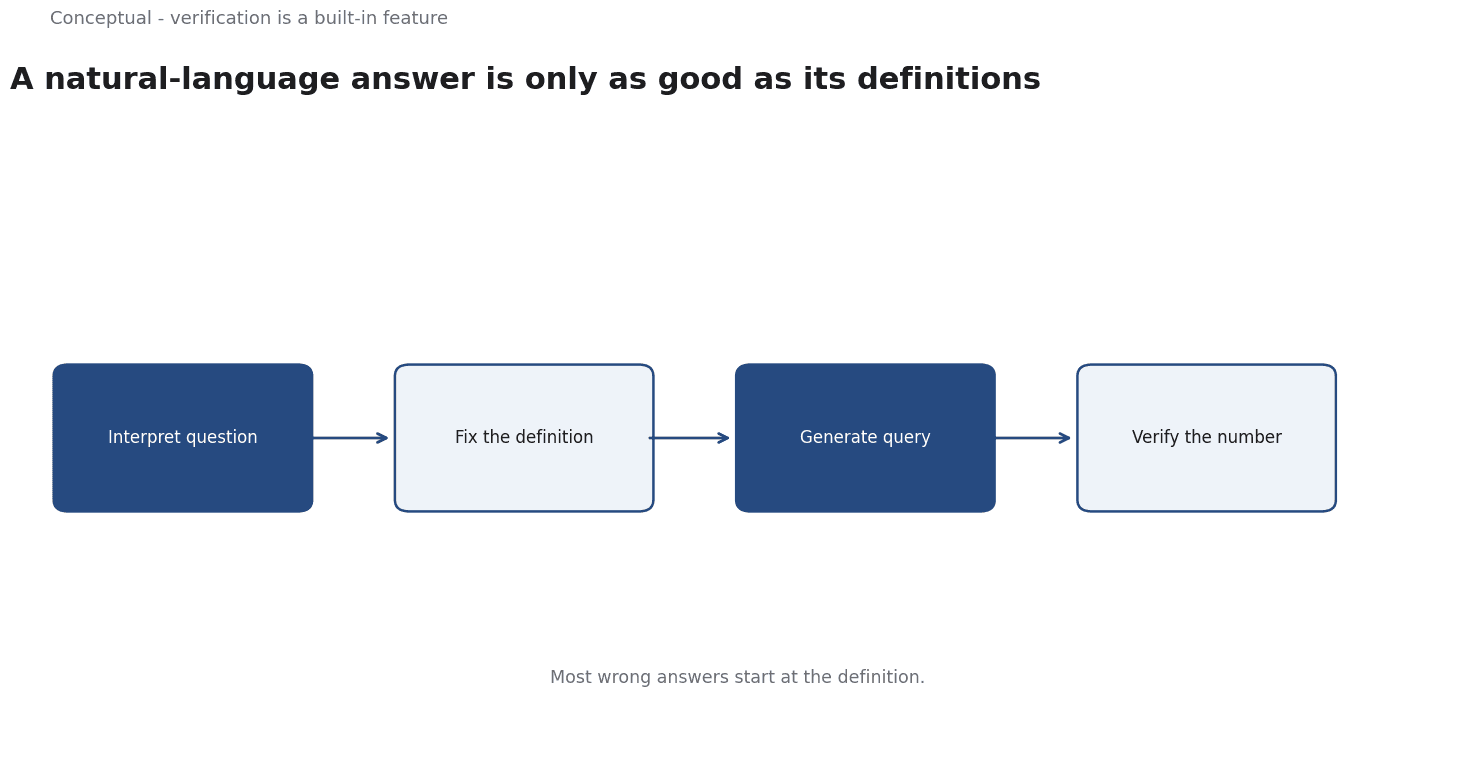
Four stages
1. Interpret the question. Clarify ambiguous terms — which time period, which definition of the metric, which population? A model that guesses here will compute the wrong thing confidently.
2. Generate the query. Translate the clarified question into SQL or a dataframe operation. The query should be readable and stored, not hidden.
3. Execute against a defined source. The source must be the authoritative one, with known freshness and definitions, as Data Governance: Managing Data as an Asset explains.
4. Verify. Check the result against a known baseline, a second query, or a stated expectation before presenting it. This is the stage most tools skip.
A worked verification example
The following is hypothetical and illustrative.
A user asks: "What was customer churn in Q3?"
Stage 1 — interpretation. The system should ask or infer: churn defined as cancelled accounts divided by accounts at the start of the quarter, for the subscription product, in the reporting currency. If the company has three definitions of churn, this is where the error enters.
Stage 2 — query. The system generates SQL selecting cancellations in Q3 and dividing by the opening customer count.
Stage 3 — execution. The warehouse returns 4.2%.
Stage 4 — verification. Three checks:
- Compare with the finance team's published figure for Q3. If it says 3.8%, investigate the definition difference rather than presenting either number alone.
- Check the denominator. If the query used ending customers instead of opening, the 4.2% is wrong by a known factor.
- Check a component. Does the cancellation count match the support system's record of cancellations within a stated tolerance?
Three decisions follow:
- Show the query with the answer, so a reviewer can see the definition that was used, as the reporting-automation article recommends.
- Show the checks, not just the result. A number with its verification is evidence; a number alone is a claim.
- Stop when checks disagree. A 0.4-point discrepancy is a signal to resolve, not to average.
Designing the verification layer
Verification is a feature that must be built, not a habit users are asked to remember.
Three design choices make it effective:
Show the query and the source. A result with its SQL and the table's last-updated time lets a reader check the definition and the freshness, which the data-governance article requires for any analysis people rely on.
Pick a baseline check per metric. For churn, compare with the finance figure; for revenue, compare with the accounting system; for counts, compare with an independent system. A generic "does the number look right?" is not a check, as the evaluation-rubric article argues for concrete scoring.
Make disagreement visible. If two checks differ, display both with their definitions rather than silently choosing one. The consumer then sees a question to resolve instead of a number to trust, which the decision-memo article recommends for honest reporting.
These choices slow the answer slightly and make it defensible, which is the whole point of a verification layer.
What natural-language analytics cannot do
It cannot define business metrics. Definitions are decisions owned by the business, as Data Governance: Managing Data as an Asset explains.
It cannot fix a bad data model. If the warehouse does not record cancellation reasons or opening balances, the query cannot compute the intended metric.
It cannot establish causation. A chart showing churn rose after a price change is a correlation. The causal-inference article covers what a genuine causal question requires.
The counterargument — that analysts will spend less time writing SQL — is fair and incomplete.
The time saved on query writing is partly spent on verification, which is work the analyst should be doing anyway.
Where the interpretation fails
Three examples:
Ambiguous time terms. "This quarter" may mean the calendar quarter or the company's fiscal quarter. If the system does not know which, it will pick one silently.
Unstated populations. "Active users" may include trial accounts in one team's definition and exclude them in another's. The number is different for each, and both are defensible locally.
Implicit comparisons. "How are sales doing?" may ask for a trend, a comparison with target, or a comparison with last year. Generating a single chart guesses at the question.
The remedy is a clarification step: when a term is ambiguous, ask before computing. A system that asks one short question is more useful than one that produces a confident wrong answer, which the human-in-the-loop article argues more broadly.
A decision test
- Resolve ambiguous terms before generating a query.
- Store and display the query with the answer.
- Execute against an authoritative, dated source.
- Verify against a baseline or a second method.
- Show the checks alongside the result.
- Stop on disagreement rather than presenting a single number.
- Treat causal questions as a separate method, not a chart interpretation.
For the reporting context, see How to Automate Reporting with AI; for the data foundation, see Data Governance.
References & Further Reading
- Anthropic, 2026. Guides to common use cases - Claude Platform Docs — Production use-case guides for ticket routing, customer support agents, content moderation, legal summarization and commerce agents.
- Wikipedia contributors, 2026. Financial statement - Wikipedia — An overview of the four financial statements and the purpose of each; a secondary reference used here with primary documents where available.