How to Automate Reporting with AI
Automating a report means automating its checks too. Read the four layers of a reporting pipeline, a worked example, and what breaks.
A report that writes itself is only useful if someone can trust the numbers. Most reporting automation focuses on the prose — generating the summary — while the data gathering and validation remain manual. That is the wrong half of the problem, because errors in a report are usually wrong numbers, not wrong sentences.
Direct answer: Automate reporting in four layers: data collection, validation, narrative generation, and review. Anthropic's use-case guides cover extraction and summarisation patterns, and cloud architecture resources describe the implementation structures available. The boundary: a model can draft the narrative from verified data, but it cannot certify that the data is correct — validation needs rules and, for high-impact reports, a person.
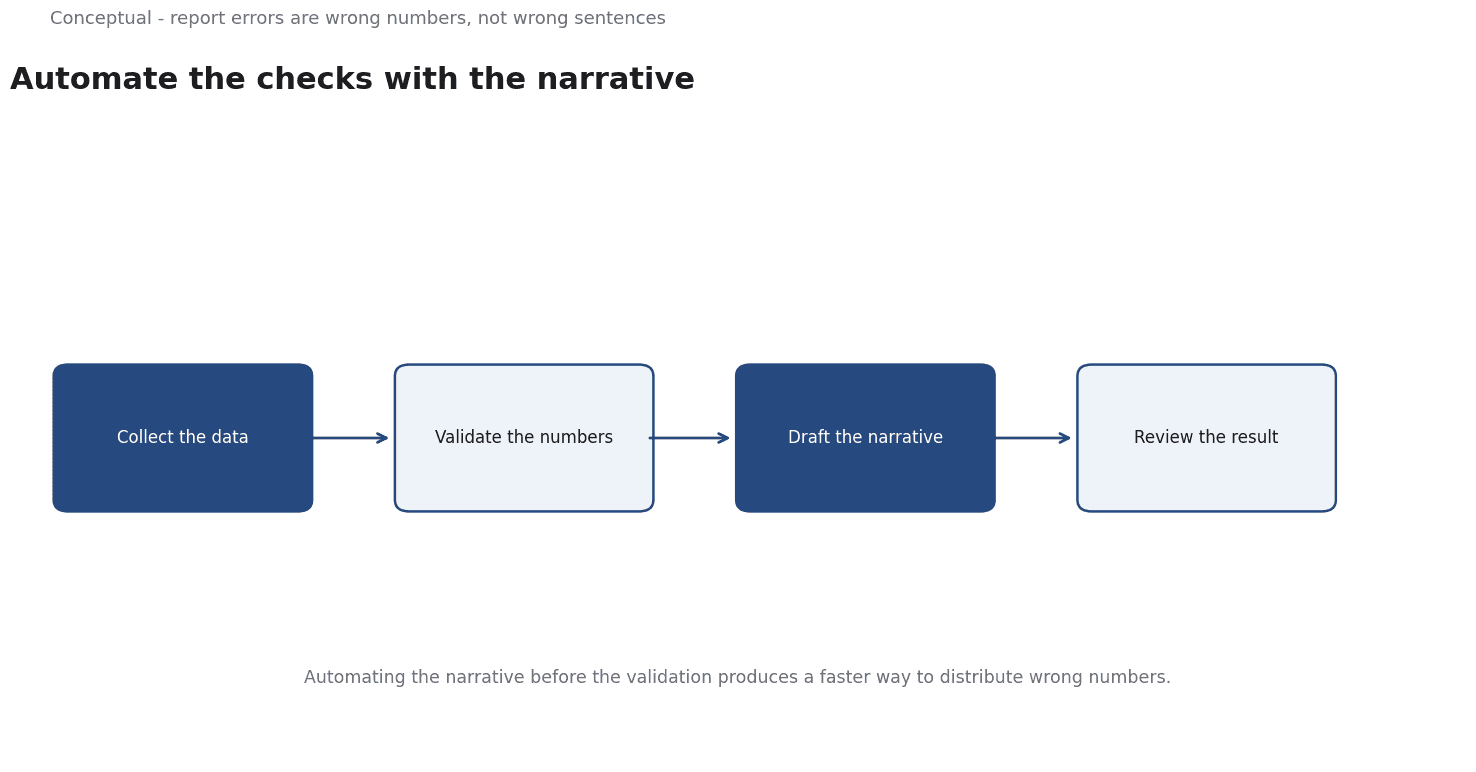
Four layers
1. Collection. Pull the numbers from defined sources on a schedule. The source and the extraction query should be recorded so a reader can reproduce the figure.
2. Validation. Check the numbers before they enter a narrative. Row counts, totals, and comparisons with prior periods catch most errors. A validation failure should stop the report, not produce a caveat in the prose.
3. Narrative. Generate the commentary from the validated numbers. Ask the model to use the supplied values verbatim and to cite the metric name, not to compute or recall figures.
4. Review. A person signs off on high-impact reports. The reviewer should see the validation results alongside the narrative, not only the final text.
The layers are ordered.
Automating the narrative before the validation produces a faster way to distribute wrong numbers.
A worked example of a weekly report
The following is hypothetical and illustrative.
A team produces a weekly sales report: revenue, order count, average order value, and the top five products. Currently an analyst spends four hours collecting and writing it.
Collection automation. Scheduled queries pull the four metrics from the warehouse. Each figure is stored with its source query and timestamp.
Validation. Three checks run before narrative generation:
- The row count for the week matches the prior week within a stated tolerance.
- Revenue equals the sum of the product-level revenue.
- Average order value equals revenue divided by orders.
If any check fails, the report is marked BLOCKED and no narrative is generated.
Narrative. The model receives the validated figures and a fixed instruction: use the supplied numbers only, state the comparison with last week, and do not speculate about causes. It produces three paragraphs.
Review. The analyst checks the validation status and reads the narrative. Sign-off takes 20 minutes instead of four hours.
Three frictions decide whether this works:
- A validation rule that always passes. If the tolerance is too wide, the check provides false comfort. Set it from historical variation, not convenience.
- Narrative drift. The model may add causal claims ("revenue rose because of the campaign") that the data does not support. The instruction must forbid unsupported causes, and review must catch violations.
- Source changes. If the warehouse schema changes, collection may silently return partial data. The row-count check exists for this reason.
Three conclusions follow:
- The saving comes from collection and drafting, not from removing review.
- Validation is the control that makes the narrative trustworthy.
- A blocked report is a success — it means the system caught a problem before distribution.
What to automate first
Choose the layer with the clearest baseline and the most repetitive work. Collection is usually first because it has a defined output. Validation is second because it protects everything downstream. Narrative is third, after the numbers are trustworthy. Review is last to change, and often should remain human.
The reporting-automation article's companion topic, AI for Spreadsheets, covers the lower-tech version of the same discipline. The principle is identical: propose, check, then apply.
What automation does not guarantee
It does not make data correct. Sources change, definitions drift, and late-arriving records alter prior periods. Validation catches some of this, not all.
It does not remove accountability. Someone must own the report and the decision to distribute it. A generated narrative with no owner is an orphan.
It does not save time if review expands.
Measure the whole cycle.
The counterargument — that dashboards have replaced reports — is true in some organisations and irrelevant to others.
A narrative still matters when a decision depends on interpreting a change, which is why the report survives even where the data is visualised.
A decision test
- Define the metrics and their source queries before automating anything.
- Build validation rules with tolerances based on historical variation.
- Stop the report on a failed check rather than adding caveats.
- Feed only validated numbers to the narrative generator.
- Forbid unsupported causes in the instruction.
- Keep human sign-off for high-impact reports.
- Measure the full cycle time, including review.
For the architecture context, see AI Integration Into an Existing Business; for the data layer, see Data Pipelines.
References & Further Reading
- Anthropic, 2026. Guides to common use cases - Claude Platform Docs — Production use-case guides for ticket routing, customer support agents, content moderation, legal summarization and commerce agents.
- Google Cloud, 2026. AI and machine learning resources | Cloud Architecture Center | Google Cloud Documentation — Cloud architecture resources for AI and ML, including the Well-Architected framing, used as a primary source for implementation structure.