AI Product Analytics Metrics that Matter
AI can summarise behaviour, not decide what to measure. Read the metrics, a worked example, and why a fluent chart can answer the wrong question.
AI product analytics promises to turn raw events into answers, which is attractive when a team has more data than questions. The risk is that the tool answers a question nobody decided was important, as the web-analytics entry treats measurement as a collection and interpretation problem, as Marketing Dashboards without the Hype argues for metrics tied to decisions, as the evaluation-rubric article requires for concrete criteria.
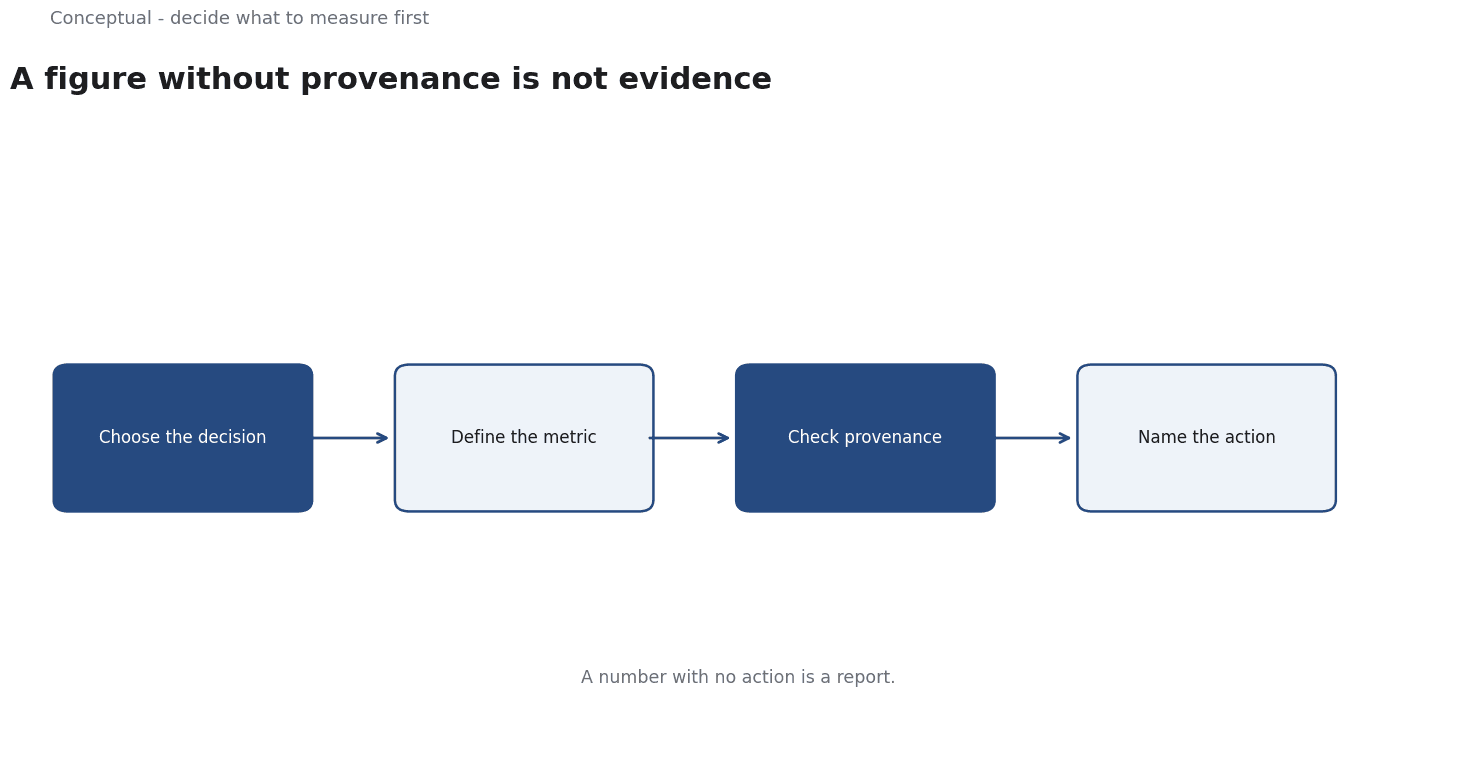
Direct answer: Choose the decision first, then the metric, then let AI summarise it with a defined cohort and a measured baseline. Web analytics provides the measurement context, and cohort analysis covers grouping users by start period. The boundary: a natural-language answer is not evidence unless it is grounded in defined data, which the hallucination article warns about, as the data-governance article requires for provenance, as the publication standard forbids guaranteed outcomes.
The metrics
A metric tied to a decision. What would the team do differently at a given value, which the dashboard article requires, as the decision-memo article requires for a specific question, as the rubric article demands for concrete criteria?
A defined cohort. Users grouped by a shared start period, which cohort analysis describes, as the retention-analytics article advises for comparable measures, as the data-governance article requires for a dated definition.
A baseline and a comparison. Improvement is relative, which the evaluation-rubric article requires, as the geo-experiment guidance recommends for comparisons, as the funnel article advises for stage measures.
A grounding check. If an AI tool names a figure, can you trace it to the underlying events, which the data-governance article requires, as the hallucination article warns about confident wrong detail, as the reduce-hallucinations article advises for checks?
Three consequences follow. The question comes before the tool, which the dashboard article argues, as the decision-memo article requires. The cohort and the events should be defined, as the data-governance article requires, as the retention-analytics article advises. And the answer should be checked against the data, as the hallucination article advises, as the rubric article requires for evidence.
A worked example
The following is hypothetical and illustrative. A team asks an AI tool which feature drives retention.
Three checks decide whether the answer is usable. First, is the decision defined, as the decision-memo article requires — will the team fund or remove a feature based on the answer, as Marketing Dashboards without the Hype advises? Second, is the cohort and the event defined, as cohort analysis and data-governance require, with a baseline, as the rubric article requires? Third, can the claimed figure be traced to the events, as the hallucination and data-governance articles advise, rather than being a plausible narrative, as the reduce-hallucinations article warns?
Three conclusions follow. A fluent answer without a decision is a report, as Marketing Dashboards without the Hype argues.
A figure without provenance is not evidence, as the data-governance and hallucination articles advise.
And the decision should be recorded with the check, as the decision-memo article requires.
What AI analytics cannot do
It cannot decide what matters, which the dashboard article treats as a decision, as the decision-memo article requires for a recorded judgement. It does not guarantee a grounded answer, which the hallucination article warns about, as the reduce-hallucinations article advises for checks. And it cannot replace a defined measurement, which the web-analytics entry treats as the base, as the data-governance article requires for provenance.
The counterargument that natural-language access to data removes the need for definitions is wrong about what a definition does, which cohort analysis and data governance show, as the worked example demonstrates.
A decision test
- Name the decision the metric should support, as Marketing Dashboards without the Hype requires.
- Define the cohort, as cohort analysis advises.
- Define the event and the baseline, as the rubric article requires.
- Check that a figure traces to the events, as data governance requires.
- Treat a fluent answer as a draft, as the hallucination article advises.
- Compare against a baseline, as the experiment guidance recommends.
- Record the decision, as the decision-memo article requires.
For the tool boundary, see AI for Product Analytics; for the measurement, see Marketing Dashboards.
References & Further Reading
- Wikipedia contributors, 2026. Web analytics - Wikipedia — Collection and interpretation of website behaviour data.
- Wikipedia contributors, 2026. Cohort analysis - Wikipedia — Grouping users by shared start period for comparison.