AI for Product Analytics: Natural Language to Insight
Product questions need event definitions and denominators. Read how to go from a question to a trustworthy metric with AI help.
Product teams ask questions in language, not SQL: "Are new users activating faster this month?" An AI layer can translate that into a chart, which removes friction — until the definition of activation, the cohort, or the denominator is wrong and the chart misleads a roadmap decision. The value depends on definitions, not on the translation.
Direct answer: Use AI to clarify product questions, map them to defined metrics and events, and generate the query — then verify the result against a known baseline before treating it as insight. Anthropic's use-case guides cover analysis patterns, and geo-experiment guidance explains how to test whether a change caused an outcome.
The boundary: a chart is a description, not a causal finding, and a fluent natural-language answer does not make a metric well-defined, which the data-governance article explains.
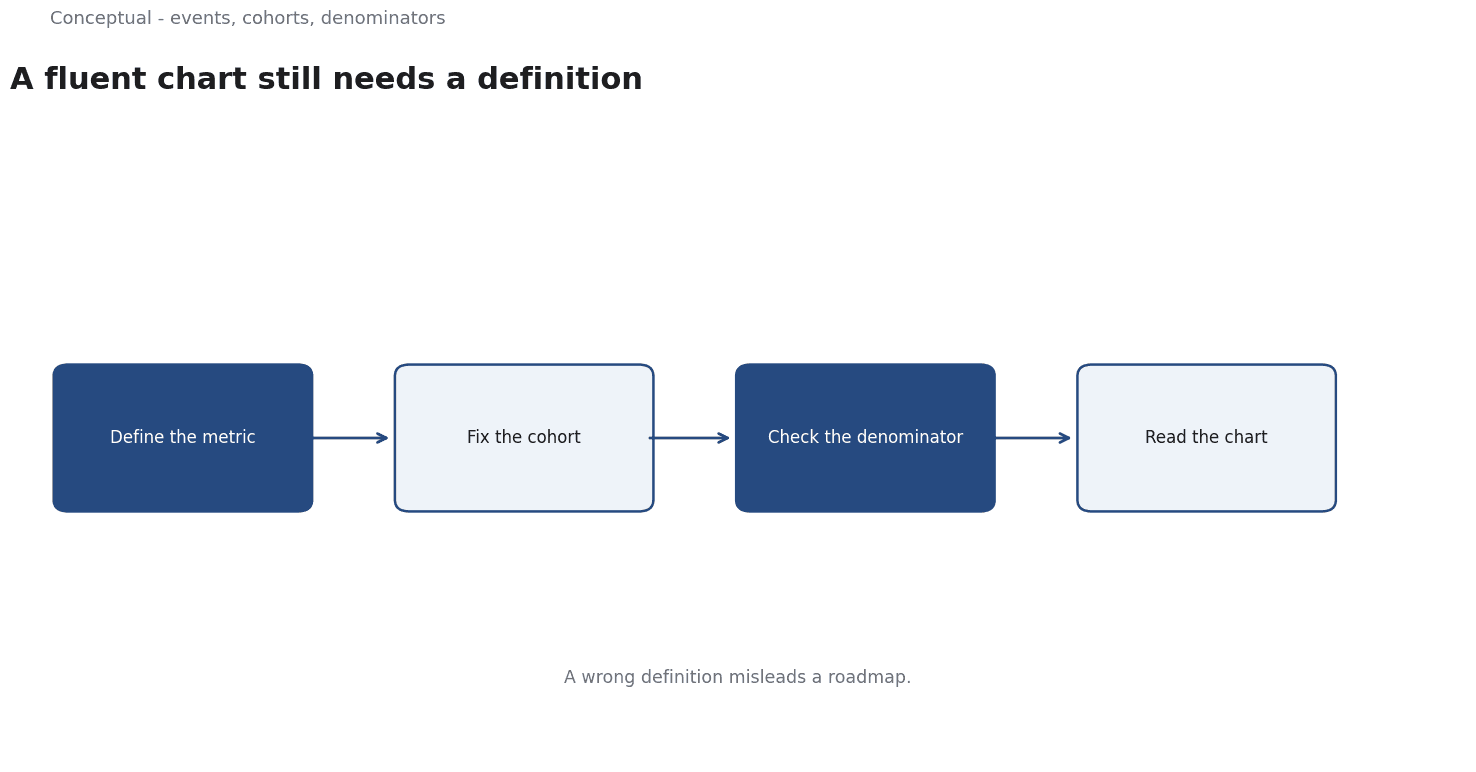
The four parts
Question clarification. Resolve terms like "active", "activation", and "this month" before generating anything. A product metric's definition is a decision, as the unit-economics article shows for CAC and LTV.
Metric mapping. Connect the question to the defined events and dimensions in your tracking plan. If the event does not exist, the answer cannot be computed, which the data-strategy article covers.
Query generation. Produce SQL or a dataframe operation that is readable and stored, not hidden behind a chat interface, as the reporting-automation article recommends.
Verification. Compare with a published baseline or a second method, and show the definition with the number, as AI for Data Analysis: From Question to Verified Answer argues.
A worked example
The following is hypothetical and illustrative.
A PM asks: "Did the onboarding change improve activation?"
The AI layer should proceed in four steps:
- Clarify: activation is defined as completing the first project within 7 days; compare the cohort after the change with the prior cohort; exclude invited collaborators.
- Map: identify the events
project_created,signup_completed, and the cohort field in the tracking plan. - Generate: SQL selecting both cohorts with the same 7-day window and exclusion rule.
- Verify: compare the result with the analytics team's published activation figure for the prior period; check that the exclusion rule was applied to both cohorts.
Three checks decide whether the insight holds:
- Definition consistency — if the prior cohort used a different activation definition, the comparison is invalid, which the revenue-recognition article explains for definitional changes in accounting.
- Tracking changes — if an event was renamed during the change, the data may be incomplete, as the monitoring article covers for instrumentation drift.
- Causality — even a clean difference in activation does not prove the onboarding change caused it, which the causal-inference article explains. A controlled experiment is needed for that claim.
Three conclusions follow:
- The AI layer's job is to make the query inspectable, not to declare the result.
- A definition change is a red flag, not a footnote.
- Causal questions require a different method, which the geo-experiment guidance supports.
Instrumentation is the prerequisite
A natural-language layer cannot answer a question the tracking plan does not support. Three conditions make product analytics AI useful:
Events are defined and stable. Each event has a name, a definition, and an owner. When an event is renamed or its meaning changes, the change must be recorded, which the monitoring article covers as instrumentation drift.
Metric definitions are central. Activation, retention, and engagement should have one documented definition each, as the unit-economics article argues for financial metrics. A natural-language layer that invents its own definition per question produces charts that cannot be compared.
The tracking plan is reachable. The AI layer should consult the plan rather than guess which event corresponds to "signup", which the data-strategy article treats as a governance question.
These conditions are unglamorous and determine whether the tool helps or misleads, which the data-quality article argues more generally.
What product-analytics AI cannot do
It cannot define metrics. Definitions belong to the product and data teams, as the governance article requires.
It cannot fix broken tracking.
It cannot establish causation from a chart. The causal-inference article covers what a genuine causal question requires, which the A/B testing article operationalises.
The counterargument — that self-serve analytics democratises data — is fair for descriptive questions and overstated for causal ones, which the funnel article distinguishes as different stages of decision-making.
A decision test
- Resolve ambiguous terms before generating a query.
- Map to defined events and check they exist.
- Show the query and definition with the result.
- Compare with a published baseline using the same rules.
- Flag definitional and tracking changes explicitly.
- Treat causal claims as a separate method requiring an experiment.
- Keep the metric owner accountable, as the governance checklist requires.
For the verification method, see AI for Data Analysis; for causal questions, see Causal Inference.
References & Further Reading
- Anthropic, 2026. Guides to common use cases - Claude Platform Docs — Production use-case guides for ticket routing, customer support agents, content moderation, legal summarization and commerce agents.
- Brian Vaver and Koehler, 2011. Measuring Ad Effectiveness Using Geo Experiments — Geo experiments for incrementality, the cleanest way to attribute marketing spend.