Asset Allocation Metrics that Matter
Allocation is a risk decision, not a return guess. Learn the source definitions, how the Sharpe ratio fits, a worked review, and where these metrics stop.
A portfolio is still often described by a single expected return, as if the mix of assets were a detail. It is not. Allocation is the main driver of a portfolio's risk profile, yet the ratios used to judge it are frequently quoted without the conditions that make them meaningful. The real problem is treating a return number as a complete verdict.
Direct answer: Set allocation across asset classes according to objective, horizon, and risk tolerance, then compare outcomes on a risk-adjusted basis using the Sharpe ratio. The Wikipedia entries define asset allocation and the ratio; neither prescribes a particular mix. The ratio is a comparison tool, not a target.
Delta: This article adds a claim-status table beyond the sources: it maps each metric to a concrete allocation decision, with claim status explicit.
The mechanism
The Wikipedia entry on asset allocation describes dividing investments among broad classes such as equities, bonds, and cash. It distinguishes strategic allocation, set to a long-term plan, from tactical and dynamic approaches that adjust with conditions. The stated logic is that an investor's objectives, time horizon, and tolerance for risk should shape the mix, and that spreading holdings reduces exposure to any single asset.
The practical consequence is that the first decision is about proportions, not about picking a winning security.
The Sharpe ratio, per its Wikipedia entry, is the excess return of a portfolio over a risk-free rate divided by the standard deviation of its returns. It is a measure of return per unit of volatility: a portfolio earning the same return with smaller swings scores higher. The practical consequence is that two portfolios with identical returns are not equivalent, and a ratio makes that difference visible in one number.
Used together, the two concepts turn a vague ambition into a comparison. Allocation states what the portfolio holds and why; the ratio states how much return was earned for the risk taken. Neither source supplies a rule for the correct mix, so choosing weights remains a decision made by the investor. The metric can compare a proposed allocation with a benchmark or with the current portfolio, but it cannot choose the objective.
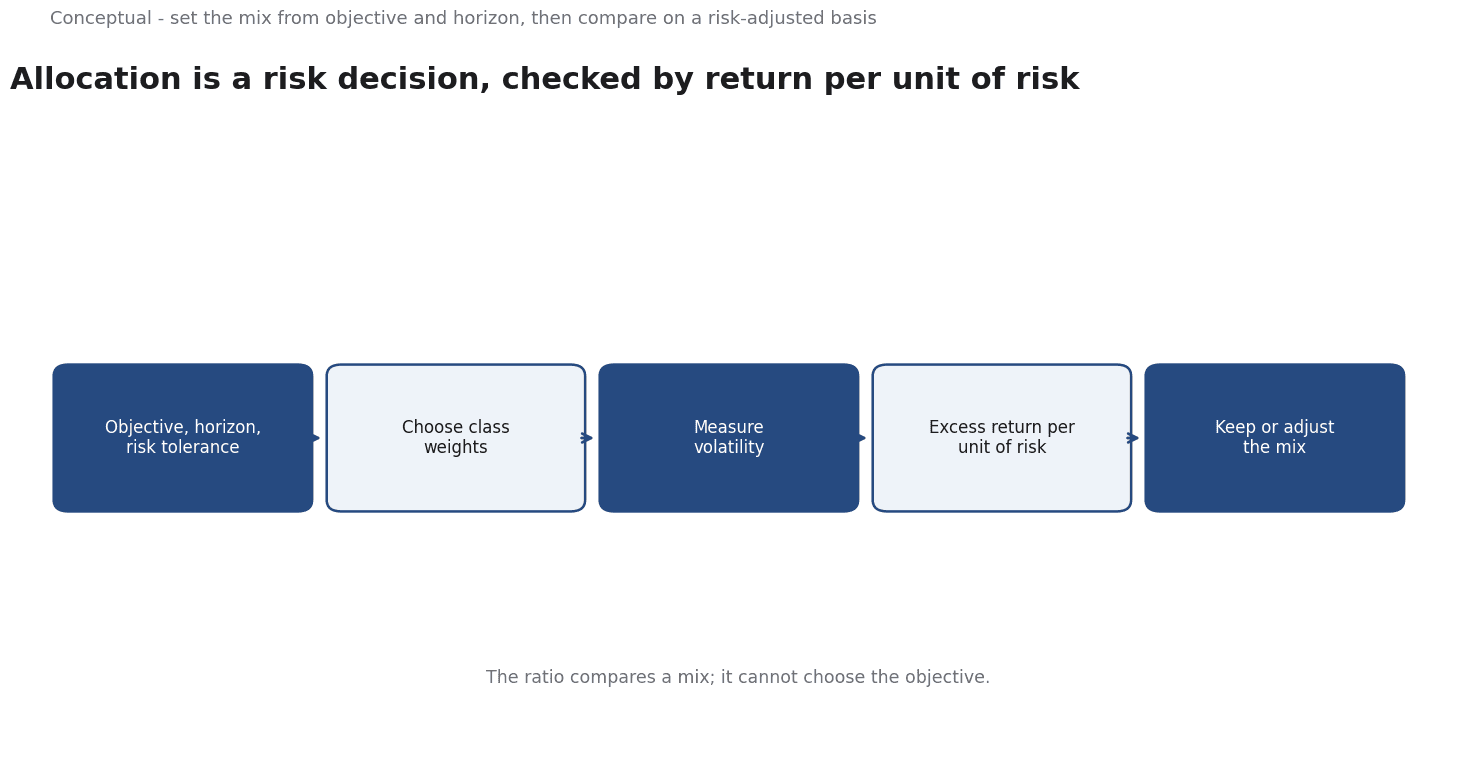
The output is a set of weights plus a risk-adjusted comparison, not a forecast. The sequence is: state the objective and horizon, choose proportions, measure the risk taken, compare excess return per unit of risk, then decide whether the mix still fits. Each step makes the next one traceable.
A worked example
The following is hypothetical and illustrative. An investor is choosing between a conservative and a growth mix. Three checks decide the review. First, do the class weights sum to the full portfolio and match the stated horizon? Second, does the chosen volatility fit the investor's tolerance, assessed before looking at returns? Third, does the proposed mix show a better risk-adjusted result than the current one over the same period? The review finds the growth mix delivered a higher raw return but a lower Sharpe ratio once its swings were counted. The investor keeps the conservative weights and documents the reason, since the raw return had been hiding extra volatility rather than extra skill. The numbers are hypothetical; the verification method is the contribution.
Evidence status
| Claim | Status | Source | Verified | Recheck when |
|---|---|---|---|---|
| Allocation spreads investment among asset classes | source-reported | Wikipedia, Asset allocation | 2026-11-18 | Definition revised |
| Sharpe ratio divides excess return by volatility | source-reported | Wikipedia, Sharpe ratio | 2026-11-18 | Formula revised |
| Risk-adjusted comparison informs allocation choice | inferred | Derived from the sources | 2026-11-18 | Risk regime changes |
The first two rows are definitions stated by the sources. The third is an inference about how the ratio can be used, because the sources do not say it should drive an allocation decision. Recheck definitions when the entries change, and the inferred row when the risk and return regime shifts.
What it cannot do
The Sharpe ratio is not a complete measure of risk. It uses standard deviation as a proxy, which treats an upward swing as the same kind of "risk" as a downward one, and it assumes returns behave in a roughly normal way. Real return distributions have fat tails and skew, so a ratio computed from them can mislead. The Wikipedia entry describes the measure, not its robustness, and that gap matters when a portfolio contains assets with asymmetric payoffs.
The number is also period-sensitive and backward-looking. Change the measurement window or the risk-free rate and the ratio moves, sometimes enough to reorder two portfolios. A high historical Sharpe ratio is not a promise of future results; it is a description of a past stretch.
A reviewer should state the measurement window next to the ratio every time it is quoted, so that a change in the window cannot be mistaken for a change in the portfolio.
Allocation itself does not remove risk. Diversification reduces exposure to assets that move independently, but in a crisis correlations can rise together and the protection fades. A mix that looked balanced in calm markets can concentrate risk when it is needed most. The sources describe the intent of allocation, not a guarantee of behavior under stress.
There is a boundary around what these metrics cover. They speak to returns and volatility, not to liquidity needs, taxes, transaction costs, or the matching of assets to future liabilities. An investor who must draw income on a fixed date faces a constraint the ratio is silent about. The mix should reflect those constraints first; the ratio is a check within them. An investor with a near-term obligation may reject the higher-ratio portfolio precisely because its volatility arrives at the wrong time, whatever the historical average says.
Finally, allocation drifts. As asset values move, weights depart from the plan and the risk profile changes without any trade occurring. The portfolio therefore needs rebalancing and a scheduled review. Each decision should record the condition that would trigger a change, so a future reviewer can tell whether a deviation was deliberate or drift.
The counterargument that a high Sharpe ratio is fair for ranking past results is incomplete when it is read as a prediction.
A decision test
- State the objective, horizon, and risk tolerance in writing.
- Choose target weights across the main asset classes.
- Confirm the weights sum to the full portfolio.
- Measure excess return and volatility over one consistent window.
- Compare the result with a relevant benchmark.
- Note the liquidity, tax, and cost constraints the ratio ignores.
- Record a rebalancing trigger and a recheck date.
The test keeps allocation a decision rather than a number-chasing exercise. Its value is that each figure carries a reason and a recheck condition, so a reviewer can see whether the mix still fits. For further reading, see Cash Flow Forecasting: A 13-Week Operating Model.
References & Further Reading
- Wikipedia contributors, 2026. Asset allocation - Wikipedia — The rationale for allocating across broad asset classes.
- Wikipedia contributors, 2026. Sharpe ratio - Wikipedia — The definition of risk-adjusted return and its computation using excess return and standard deviation.