Brand Awareness Tracking Best Practices
Awareness moves slowly and is easy to overstate. Read the signals worth tracking, a worked comparison, and what the numbers cannot prove.
Tracking brand awareness is mostly a problem of time, not of definition. A single reading tells a team almost nothing: a number only becomes useful when it sits against a baseline, is collected on a steady cadence, comes from the same instrument each time, and clears the ordinary noise of the series before anyone calls it a change. The standards published by AAPOR force a team to name the population, the wording, and what a result can support before the first survey goes out, and the geo-experiment work of Vaver and Koehler supplies a comparison design that can attribute a change to a campaign rather than to background movement. This article is about the discipline of tracking awareness over time.
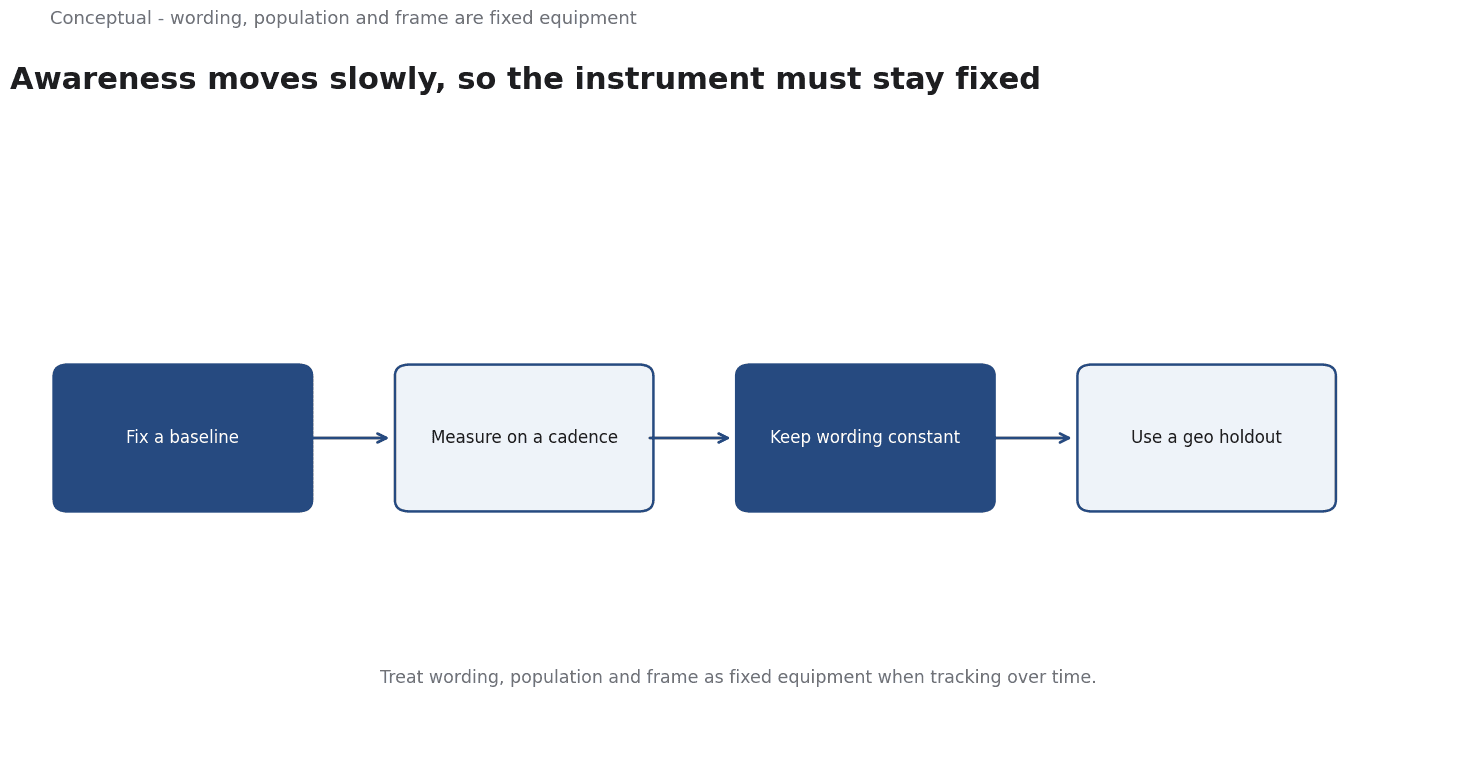
Direct answer: To track awareness over time, fix a baseline from a defined population, measure on a cadence matched to how fast the signal moves, and keep the wording, population, and sampling identical at every wave. Read a change only when it clears the normal variation of the series, and use a geo holdout to test whether a campaign caused it. A time series can show a change and test a cause, but a perception measure alone cannot be converted into a revenue figure.
Delta: The two sources describe one geo experiment and one survey fielded to standard; this article adds the temporal discipline that turns isolated readings into a comparable series - baseline, cadence, a constant instrument, and an explicit noise threshold.
Setting a baseline you can compare against
A baseline is a reference point measured under the same conditions that will be used later. Without one, a number has no direction: a level of 30 percent could be a high point after a decline or a low point before a rise, and the figure alone does not say which. Both named sources assume such a reference. A survey standard asks what population and wording produced the number (AAPOR), and a geo experiment needs pre-period data to model what would have happened without the campaign (Vaver and Koehler).
The baseline is not just a number but a method paired with a reading. Record who was asked, how they were selected, what question was asked, and when, and fix the population and sampling frame before any later reading is taken. Vaver and Koehler build their design on the relationship between test and holdout regions during a pre-period, so the baseline must capture both the level of the signal and the gap between the regions being compared. An undocumented baseline cannot be reproduced, and an unreproducible baseline cannot anchor a time series.
Where the design allows, take more than one pre-period reading. A single baseline point gives no sense of how much the series normally moves between waves, so every later shift looks equally surprising. Repeated pre-period observations reveal the ordinary drift and the usual gap between test and holdout regions, which is the background a geo experiment uses to judge a later difference (Vaver and Koehler). A baseline belongs to one signal in one market and does not travel: each series should be compared only to its own starting point, since the same question applied to a different population is a different measure.
Cadence and the cost of measuring too often
Cadence should follow the natural speed of the measure rather than the convenience of a reporting meeting. Survey-based measures are slow and expensive to field; observed behavioural series can be read far more frequently.
A practical cadence plan follows a few rules:
- Field survey waves at a fixed interval, and keep that interval stable across waves.
- Read behavioural series on a regular schedule under a fixed definition, so a spike can be located in time.
- Align the reporting rhythm to the decision being informed, not to the availability of a dashboard.
- Resist adding readings purely to get more data: every extra reading is another chance to overreact to noise.
The cost of measuring too often is that noise gets promoted to signal. Every series carries ordinary variation, and the more often a team looks, the more likely it is to find a movement that invites an explanation. A holdout and a pre-period supply the reference needed to judge whether a movement is unusual (Vaver and Koehler), but only when readings arrive on a comparable cadence. AAPOR's requirement of a defined population and sampling applies at every wave, so a faster cadence also multiplies the occasions on which that standard must be met. A slower, steadier cadence is usually the cheaper and more reliable choice.
Keeping the instrument constant
An instrument is constant only when the question, the people, and the method of selecting them are the same at every wave. AAPOR's standards make this concrete: question wording, the definition of the population, and the sampling procedure all shape the answer, so changing any of them changes what the number means. A survey that rephrases a question between waves has not measured a change in awareness; it has measured a change in the question.
The discipline of tracking over time is to treat wording, population, and frame as fixed equipment.
The requirement extends beyond the question. Contact mode, weighting, and the rules for who counts as a respondent are part of the instrument and must be held steady or documented. When a change is unavoidable, the correct response is not to adopt the new number quietly but to run an overlap period in which old and new methods are fielded together. That bridge, grounded in the same survey standards, lets a later figure be read against the earlier series rather than treated as a fresh start.
The same logic applies to observed behavioural series even though no questionnaire is involved. A tracking definition, a tagging rule, or a filter is the instrument for that series, and an undisclosed change to any of them produces a break that looks like a real shift. The guardrail in both cases is documentation: log what was measured, how, and from which population at every wave.
A worked example
The following is hypothetical and illustrative. A company tracks aided recognition in a fixed population of category buyers across a panel of regions, with a survey fielded on the same wording and sampling frame each quarter. Two pre-campaign waves put recognition at 30 percent in the regions that will receive the campaign and 29 percent in similar regions held out. That one-point gap and the small drift between waves are the background against which any later change must be judged. A behavioural series logged monthly under a fixed definition shows ordinary variation that a single spike could be mistaken for a trend.
After two quarters, recognition reads 38 percent in the campaign regions and 30 percent in the holdouts, while the behavioural series shows a sustained step in the campaign regions only. First, the pre-period gap and drift set the noise floor: a one-point holdout move is ordinary variation, so the eight-point move is read against the holdout rather than against zero. Second, the campaign's estimated contribution is the difference between groups - roughly seven points - not the raw eight, because the holdout also rose (Vaver and Koehler). Third, two pre-campaign waves make the comparison credible; with one baseline reading there is no way to separate a real shift from the series' own wobble. Fourth, wording, population, and sampling were unchanged, so the change is not an artifact of the instrument (AAPOR).
Three decisions follow: report the difference between groups against the pre-period background, keep later waves on the same wording and frame, and treat the result as a change in awareness that still needs a separate step before it links to conversion.
For the reporting layer that keeps a series like this readable, see Marketing Dashboards Without the Hype.
What tracking cannot prove / A decision test
A steady series plus a holdout can show that awareness changed and test whether a campaign caused it. It cannot measure sentiment, since a brand can be widely known and disliked; cannot turn a perception into a revenue figure without a separate link to buying; cannot compare one category with another, because the same question on a different population is a different measure; and cannot isolate one channel unless the design separates its effect from other causes. These are limits a well-kept series respects, not reasons to abandon tracking. The claim that awareness is too soft to track is wrong, but the harder task is attributing a change to one cause, which is what the geo comparison is for (Vaver and Koehler).
A decision test:
- Fix one baseline from a defined population, and record the wording and sampling behind it.
- Set a cadence matched to the signal's speed, and hold to it across waves.
- Freeze the instrument; log any change and bridge it with an overlap wave.
- Estimate ordinary variation from repeated pre-period readings, and set a noise threshold before results are read.
- Report the difference between campaign and holdout regions, not raw growth (Vaver and Koehler).
- Confirm that population, wording, and sampling are identical across waves (AAPOR).
- Treat a detected change as an input to a later conversion measure, not a revenue result.
A counterargument
A reasonable critic could argue that the insistence on a fixed, documented instrument - correct under AAPOR's standards - makes the series fragile in exactly the situation tracking is meant to serve: markets where wording and sample composition must change to stay representative.
AAPOR's requirement that population, wording, and sampling be held steady is a standard for comparability, not a claim that the underlying construct is stable; the overlap-wave remedy assumes the budget and lead time to run two instruments at once.
Vaver and Koehler's geo design is offered as the way to attribute a change to a campaign, but a geo experiment estimates an average effect across regions and a campaign window, not the slow drift a quarterly tracker is built to detect - the two sources answer different questions than the single "discipline of tracking" frame implies.
References & Further Reading
- Brian Vaver and Koehler, 2011. Measuring Ad Effectiveness Using Geo Experiments — Geo experiments for incrementality, the cleanest way to attribute marketing spend.
- American Association for Public Opinion Research, 2026. AAPOR — The professional association for public opinion and survey research; its standards and resources underpin the survey-design discussion.