Brick-and-mortar Economics Best Practices
A grounded look at physical store economics, how point-of-sale data shapes decisions, and where common retail metrics hide the true cost of a location.
Physical retail is often judged with the same top-line metrics as online channels, which obscures the costs that only a physical location carries. Rent, staffing, and inventory tie up capital before a single sale occurs, so revenue alone says little about whether a store creates value. Brick-and-mortar economics is the discipline of reading those costs correctly rather than assuming that traffic equals health.
Direct answer: A brick-and-mortar business operates through a physical location where customers transact in person, and a point-of-sale (POS) system records those transactions. The practical decision is how to use that transaction data to judge store-level contribution after the location's fixed and variable costs, instead of treating sales volume as proof that the store works.
Delta: This article adds a contribution frame beyond the sources: it maps point-of-sale signals to the store-level cost decisions they should inform, with claim status explicit.
The mechanism
A brick-and-mortar business is defined by a physical presence that customers can visit. That simple fact drives the economics: a store must pay for the space, the people staffing it, and the stock sitting on its shelves, whether or not enough customers arrive. Online operations carry their own costs, but the physical form concentrates occupancy and labor into a fixed commitment at a specific place.
The practical consequence is that the break-even question comes before the growth question for any location.
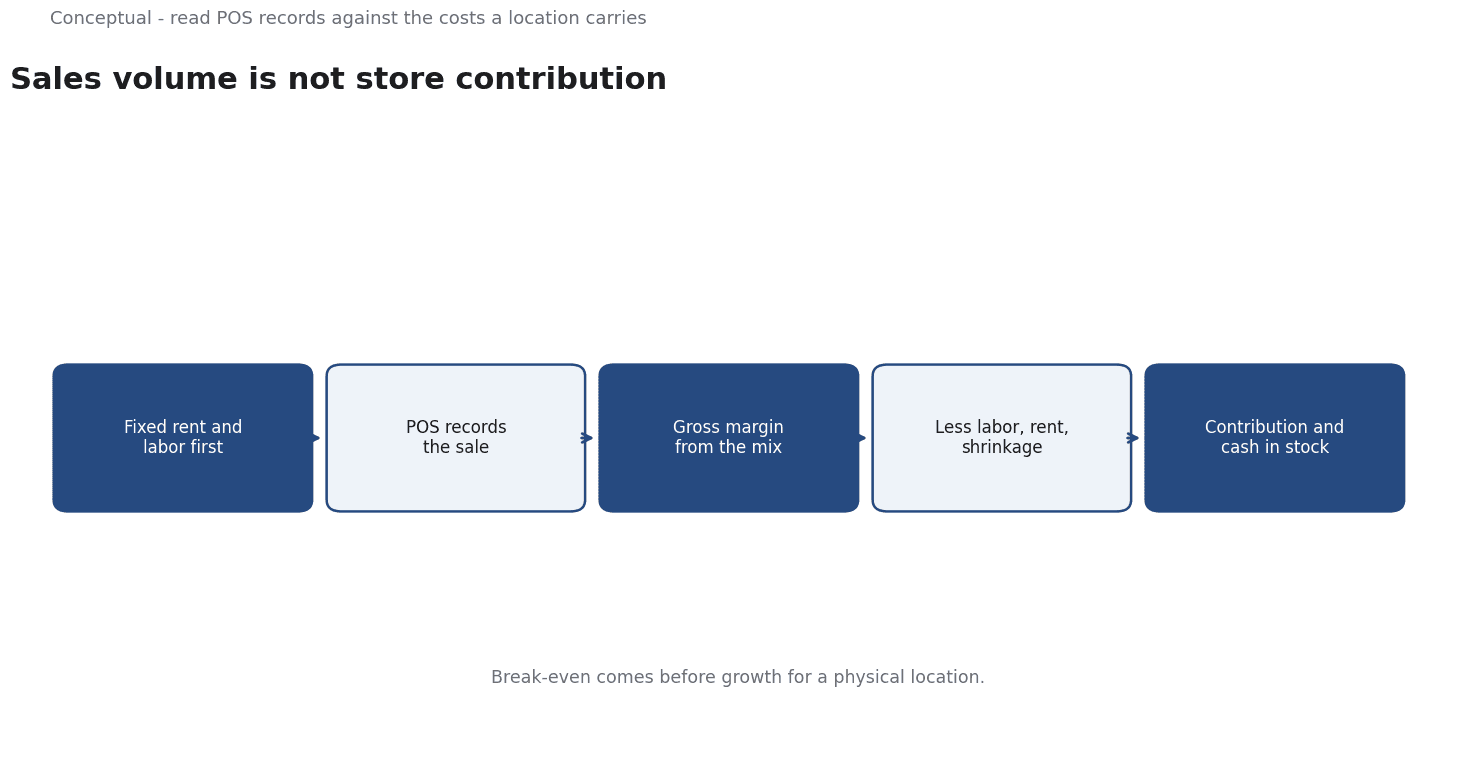
A point-of-sale system is where a sale is completed and recorded. It combines hardware and software, often including a register, a barcode scanner, and a receipt printer, and it maintains records of what was sold. The practical consequence is that the POS is both a transaction tool and a data source: each sale produces a line item that can later be aggregated into product mix, timing, and basket composition. That record is the most direct evidence a store has about what actually happens on the floor.
Turning POS records into economics requires separating what a store sells from what it costs to sell. Gross margin on the items moved is only the starting point; labor hours, rent, utilities, and shrinkage all consume that margin. The practical consequence is that two stores with identical sales can have very different contribution, depending on how much labor and stock each needs to generate those sales. A manager who watches revenue without watching the cost base will misread a busy but thin-margin location as a success.
The timing of inventory is another lever. A POS record shows when an item left the shelf, but the capital was committed when it arrived, often weeks earlier. The practical consequence is that fast sell-through is valuable not just because it satisfies demand but because it shortens the window in which cash is trapped in stock. Store economics therefore couples the transaction view with an operating view: sales rate, replenishment lead time, and the carrying cost of inventory all belong in the same decision.
A worked example
The following is hypothetical and illustrative. A retail chain has two stores with the same monthly sales and wonders which to expand. Three checks frame the answer. First, read the POS mix: the first store sells mostly high-margin items while the second relies on discounted lines, so equal revenue masks different gross margin. Second, attribute the costs: the second store needs more labor hours per transaction and sits in a higher-rent unit, so its contribution after occupancy is lower. Third, examine stock: the second store carries slower-moving inventory, tying up cash longer. The outcome is a decision to expand the first store's format rather than the second's, based on contribution and capital efficiency rather than the identical top-line figures. The scenario is illustrative, not a report of any real chain, and it shows why transaction data must be paired with the cost structure to mean anything.
Evidence status
| Claim | Status | Source | Verified | Recheck when |
|---|---|---|---|---|
| A brick-and-mortar business operates through a physical customer-facing location | source-reported | Wikipedia brick and mortar | 2026-11-18 | Business model definition changes |
| A POS system records sales and is used to complete transactions | source-reported | Wikipedia POS | 2026-11-18 | POS system scope changes |
| POS mix combined with occupancy cost determines store contribution | inferred | Derived from the sources | 2026-11-18 | Cost allocation method changes |
The source-reported rows define the business form and the transaction system. The inferred row combines them with a cost perspective that the sources do not themselves provide, so it is a reasoning step to be validated against a specific store's numbers. Recheck the table when the definition of the business form or the way costs are allocated changes, since either shift changes what the transaction record can support.
What it cannot do
A POS record does not explain why a sale happened. It shows that an item moved at a given time, not whether a display, a promotion, or a recommendation caused the movement. Store economics built purely on transaction data can describe patterns but not causes, so a manager who cuts a product because it sells slowly may remove an item that draws customers who buy other things. The record is precise about outcomes and silent about the mechanisms behind them, and that silence is easy to forget when the numbers look authoritative.
The hidden cost is the work of allocation. Shared expenses, head office time, and central warehousing do not arrive neatly tagged to a single store, yet a contribution view must decide how to treat them. Different allocation rules can make the same location look profitable or not, which means the analysis carries assumptions that are not in the source data. That cost is not just arithmetic; it is a negotiation about what counts, and it can dominate the conclusion if left unexamined.
A busy store can lose money if the mix is low-margin and labor is high, while a quiet store can be healthy if it serves a small, efficient basket with low occupancy cost. The POS captures the transactions, but a simple count of visits or sales volume hides the structure underneath. Teams that reward volume alone will push staff toward activities that raise the count without raising contribution, and the resulting behavior can erode the very economics the metric was meant to improve.
There is a boundary around what the transaction system covers. It records completed sales, not the browsing that did not convert, the competitor down the street, or the reputation that brings a customer in. Those factors matter to a location's prospects but leave no clean line item. The brick-and-mortar definition also says nothing about which costs are fixed in the short run, so a store that looks unprofitable on a fully loaded basis may still be worth keeping while it covers its incremental costs.
The data informs the decision; it does not make it.
Because of these limits the analysis needs regular review. Product mix, rent, and labor markets change, and a cost assumption that held last year can quietly invert a conclusion today. A team should revisit its allocation rules and its definition of contribution when the store's role changes or when new transaction evidence contradicts the earlier picture. Keeping the status of each claim explicit helps, because it separates what the POS actually recorded from the cost judgments layered on top of it.
Counterargument: the claim that detailed store economics is overkill is fair for a single owner-occupied shop with stable costs, and incomplete for a chain where allocation and mix differ materially across locations.
A decision test
- State the store-level decision, such as expanding, closing, or changing the product mix.
- Pull POS data for the period and summarize sales by product category and time.
- Compute gross margin from that mix rather than relying on total revenue.
- List the costs tied to the location and note which are fixed in the decision window.
- Calculate contribution after the relevant costs and compare it across locations.
- Check the inventory tied up in slow-moving lines and include the capital cost.
- Set a review trigger tied to a change in rent, labor, or mix, not a fixed date.
These steps turn a store review into a repeatable check rather than an argument about impressions. If step four is unresolved, the contribution figure is not meaningful, because a cost that is fixed in the short run should not be treated the same as one that scales with sales. The test keeps the decision anchored to what the POS records and to the cost assumptions made explicit around it.
For further reading, see Cash flow forecasting: a 13-week operating model.
References & Further Reading
- Wikipedia contributors, 2026. Brick and mortar - Wikipedia — Physical business premises rather than online only.
- Wikipedia contributors, 2026. Point of sale - Wikipedia — Systems for recording transactions at the point of sale.