Burn Rate: a Decision Framework
Burn rate is a cash-flow signal, not a verdict. Read how to compute it, a worked example, and the decisions it can and cannot support.
Teams often quote a single burn number as if it settled the question of how long the company can last. The problem is that burn rate collapses several different cash flows into one figure, so a number that looks reassuring in one month can mislead in the next. The underlying definitions of cash flow and working capital make clear that the figure is only as good as the cash movements behind it.
Direct answer: Burn rate is the net rate at which a company's cash balance falls over a period, and it is useful only when paired with the cash balance and the timing of inflows and outflows. Wikipedia's cash flow entry defines the inflow and outflow structure, and the working capital entry explains the short-term items that distort a single month.
Use it as a screening signal for decisions, not as a standalone forecast.
Delta: This article adds a decision framing beyond the sources: it maps the cash-flow and working-capital definitions to the specific question of whether burn justifies a hiring, spending, or financing decision, with claim status made explicit.
The mechanism
The starting concept is cash flow, which Wikipedia defines as the net amount of cash and cash equivalents moving into and out of a business over a period. Burn rate is a special case of that definition: it focuses on the negative net movement, the extent to which outflows exceed inflows. The practical consequence is that the two components must be separated before they are combined. A company with large but lumpy inflows can show a frightening net burn in one month and a near-zero burn in the next, even though its underlying operations have not changed. Reading only the net figure hides that structure and invites a decision based on noise.
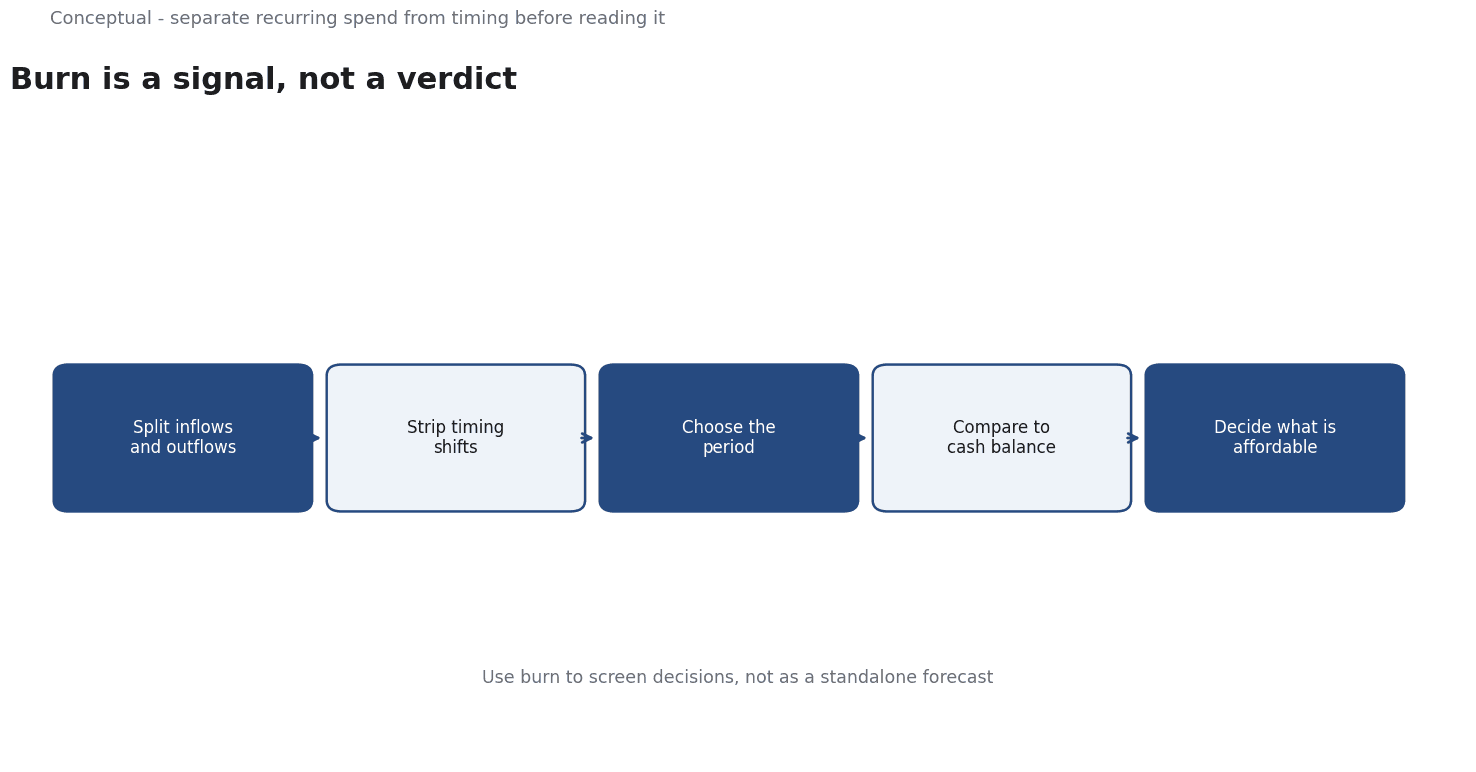
The second concept is working capital, which the working-capital entry describes as the current assets available after accounting for current liabilities. It matters because many cash movements are timing shifts rather than true consumption. Paying a supplier early, collecting a receivable late, or building inventory each changes the cash balance without changing the long-run economics of the business. A burn figure computed across such timing shifts can overstate or understate the underlying rate of spend, so the mechanism requires separating operating timing from structural cash consumption before the number is interpreted.
A third idea is the choice of period and whether burn is measured gross or net. Short windows amplify seasonality and one-off payments; long windows smooth them but react slowly to a genuine change in trajectory. There is no single correct window, only a window appropriate to the decision in front of you. The mechanism therefore produces not one number but a small family of readings: a recent month, a trailing average, and a view that strips out known one-off items. The decision determines which of those readings is relevant, not the other way around.
Finally, burn becomes meaningful only when compared with the cash balance and the obligations ahead. The same monthly burn is benign for a company with two years of runway and alarming for one with two quarters. The practical consequence is that the mechanism ends in a ratio and a question rather than a headline figure: given this burn and this balance, which decisions remain affordable, and which should be deferred until the reading is confirmed over another period?
A worked example
The following is hypothetical and illustrative. A small software company reports a net cash decline over one quarter and is considering two hires. Three checks decide whether the burn supports the decision. First, the cash-flow split: were the outflows recurring salaries and infrastructure, or a single annual prepayment that will not repeat? Second, the working-capital timing: did a large receivable settle late in the quarter, making the net burn look worse than the underlying run rate? Third, the comparison against the balance: with the cash on hand and the confirmed recurring outflows, how many quarters of runway remain if the hires proceed? The outcome is a decision rule rather than a verdict. If the burn is driven by recurring costs and the runway stays above the company's internal floor after hiring, the reading supports proceeding. If it is dominated by a one-off or a timing slip, the honest conclusion is that the quarter's figure should not drive the decision at all.
Evidence status
| Claim | Status | Source | Verified | Recheck when |
|---|---|---|---|---|
| Cash flow is defined as net inflow and outflow of cash over a period | source-reported | Cash flow - Wikipedia | 2026-11-18 | Definition or scope changes in the source |
| Working capital equals current assets less current liabilities | source-reported | Working capital - Wikipedia | 2026-11-18 | Accounting treatment of current items changes |
| Separating timing effects improves burn interpretation | inferred | Derived from the sources | 2026-11-18 | New evidence on short-term cash forecasting accuracy |
The two definitional claims are reported directly from the reference entries and are stable, while the claim about timing effects is an inference drawn from combining them. The implication is that the definitions can be trusted as stated, but the interpretive step should be revisited if new guidance on short-term cash forecasting appears or if the company's own payment patterns change materially.
What it cannot do
The first limit is that burn is a backward-looking summary, not a forecast. It records what happened to the cash balance over a window; it does not contain the information needed to predict the next window. A company can have a flat historical burn and still be about to sign a large commitment that changes it. The concept cannot anticipate an event that has not yet affected cash, so any claim that burn alone tells you the future runway is an overreach. It describes a past rate of change and leaves every forward-looking assumption to the person using it.
A hidden cost lies in the precision illusion. A burn figure is presented as a single number with the authority of accounting, but it depends on classification choices about what counts as an operating, investing, or financing outflow, and on the timing of recognition. Two analysts using the same raw transactions can produce different burns. The cost is not the arithmetic but the false confidence the number invites in meetings, where a precise-looking figure can end a debate that actually needs the underlying schedule. The more polished the presentation, the easier it is to skip that schedule.
Net burn after inflows can look small while gross outflow grows quickly, masking a dependence on a single customer, a grant, or a financing tranche. If that inflow disappears, the true consumption rate is exposed all at once. The measure fails precisely when the inflow is fragile, which is often when the decision matters most, so a report that shows only the net figure is structurally inclined to reassure at the wrong moment. Checking the gross figure is the only way to see the scale of what is being hidden.
There are settings where burn should not be applied at all. Early pre-revenue research, project businesses with milestone billing, and companies holding large non-operating assets can all show burn figures that say little about sustainability. In these cases the cash balance and the committed obligations carry the information, and forcing them into a monthly burn narrative discards context. The honest boundary is that burn is a tool for relatively steady operating businesses, not a universal measure of corporate health. Applying it outside that boundary produces a number that looks familiar but answers the wrong question.
Finally, burn needs scheduled review because its meaning drifts. Payment terms change, teams grow, and one-off items become recurring. A figure that was a reliable signal two quarters ago can be stale now. The practical requirement is to re-derive the components on a fixed cadence, to keep the period and the classification consistent between readings, and to record which decisions relied on which figure. Without that discipline, burn becomes a number people repeat rather than a measure they understand, and the decisions built on it inherit an unexamined assumption.
The counterargument that burn is too crude to guide decisions is fair for volatile, pre-revenue, or project-based firms and incomplete for steady operating businesses, where a consistent net figure over several periods is a genuinely useful screening signal.
A decision test
- State the decision the burn figure is meant to inform.
- Separate recurring outflows from one-off and timing-driven cash movements.
- Compute burn over more than one window, including a trailing average.
- Compare the reading with the cash balance and the runway floor.
- Check whether the net figure depends on a fragile inflow.
- Confirm that the classification of each outflow is consistent between readings.
- Record which decision relied on which figure and set a review date.
None of these steps requires a more complex model; they require consistency and honesty about what the number does and does not contain. The test is passed when a reader can see which cash movements drove the figure and which decision it supports, and failed when the burn is quoted as an unexplained headline. For further reading, see Cash Flow Forecasting.
References & Further Reading
- Wikipedia contributors, 2026. Cash flow statement - Wikipedia — Operating, investing and financing activities, and why net income and cash flow differ.
- Wikipedia contributors, 2026. Working capital - Wikipedia — Current assets minus current liabilities, and why a growing business can be cash-constrained; secondary reference.