Customer Retention: Keeping Customers Is Cheaper Than Acquiring Them
Retention is two problems wearing one name: involuntary churn you can fix, and voluntary churn you must earn. Read how to tell them apart.
"Retention is cheaper than acquisition" is true in the way that "it is cheaper to repair a car than to buy one" is true — as a general shape, and useless until you know which car you have. The advice does not tell you what to do on Monday, because retention is two different problems with two different solutions, and the aggregate churn rate hides both.
Direct answer: Involuntary churn happens to customers who wanted to stay — a failed payment, a churn caused by a price change you did not warn them about, a service outage. It is a failure of operations or of communication, and it is measurable and fixable. Voluntary churn happens to customers who chose to leave, and it is a judgement you did not earn. The first is an engineering and process problem; the second is a product and value problem.
A retention programme that does not separate them will spend its budget on the wrong one.
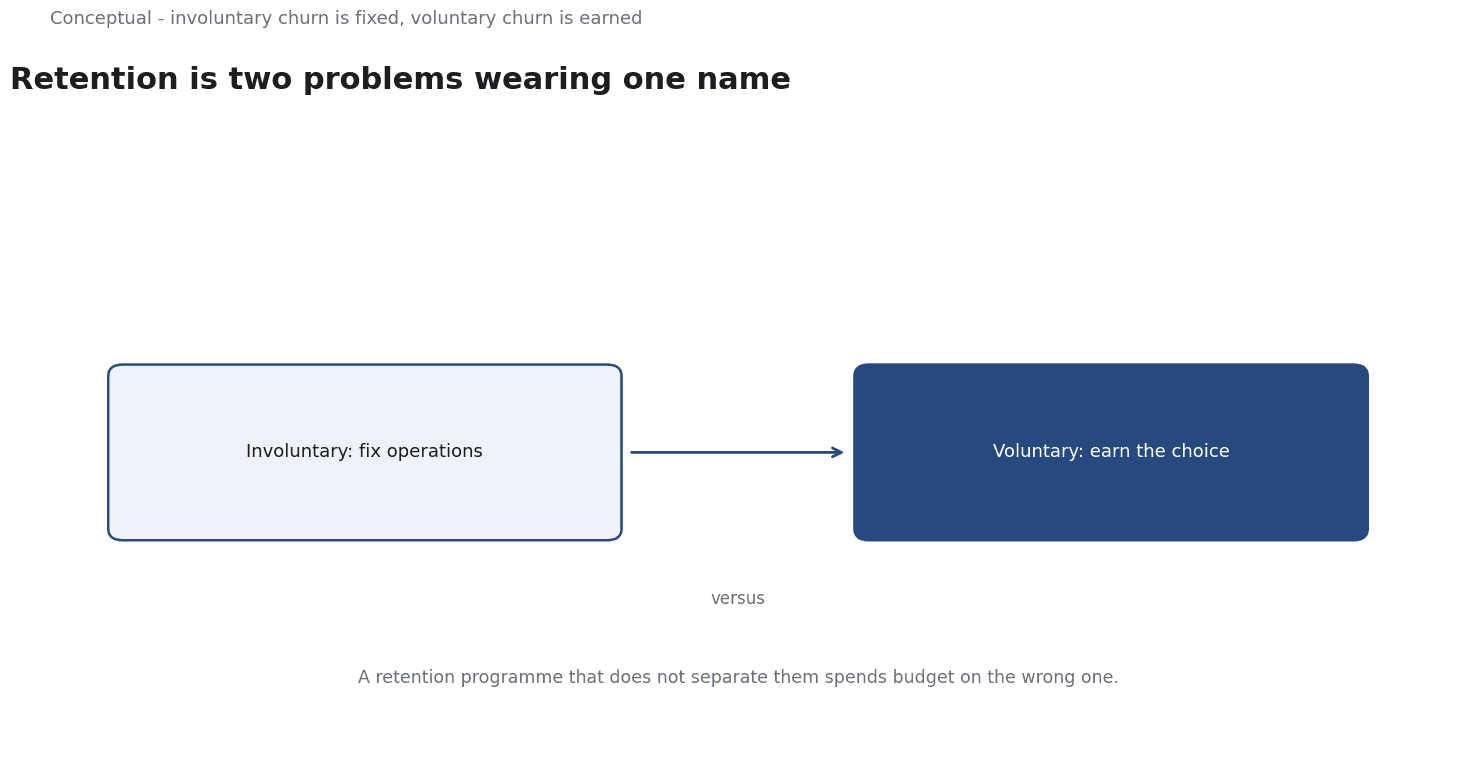
The split that determines the playbook
The two failure modes look identical in a churn metric and nothing alike in practice.
Involuntary churn has a proximate cause you can name. The card expired. The company was acquired and the service was discontinued. The customer wanted more seats and the tier they bought did not have them. Your instrument is operations: dunning, backup payment methods, cancellation-flow interviews, proactive outreach before a renewal date.
Voluntary churn has a distributed cause. The product stopped being the best available choice for what the customer now needs. The value that justified the price eroded. A competitor solved a problem they now care about. Your instrument is product: usage analysis, interview the departing, and — most usefully — compare the behaviour of accounts that stayed with the accounts that left.
The diagnostic that separates them is cheap and usually not done: look at what departing accounts did in their last period. An account whose usage collapsed weeks before the cancellation is telling you something about value; an account that used the product heavily right up to the cancellation and then vanished on a billing date is telling you something about a payment. Those two situations have nothing in common, and treating them with the same intervention is how retention programmes end up as generic outreach emails.
Why the measurement has to be a cohort, not a rate
An aggregate churn rate — "we lost 8% of customers last quarter" — mixes several different populations and several different denominators. New customers churn at a different rate from long-tenured ones. Accounts acquired through a discount churn differently from accounts acquired at full price. Small accounts churn differently from large ones. The aggregate rate moves for reasons that have nothing to do with anything the retention team did.
The fix is cohort analysis: take the customers acquired in a given period, follow them, and compute the survival curve for that cohort alone. This gives you three things the aggregate cannot.
First, it separates the churn that happens early — which is usually an onboarding or expectation-setting failure — from the churn that happens late. Second, it gives you a curve rather than a rate, and the shape of the curve is more informative than its level. A business whose churn is concentrated in the first two months has a different problem from one whose churn is a steady drip across the tenure. Third, it gives you something comparable over time: if the cohort acquired last quarter has a better curve than the one before it, an intervention worked.
The measurement depends on having the right events recorded, and analytics systems make this explicit. Google Analytics describes an event as measuring "a specific interaction or occurrence on your website or app" — a page load, a link click, a purchase, an app crash, an impression served. Every retention curve you compute is built from a chosen set of those events, and a curve built on the wrong events will agree with nobody else's.
Retention is a margin question, not a count question
Keeping a customer is not automatically good.
The metric that avoids this trap is gross-margin-adjusted retention: what fraction of the gross profit you would have earned is still being earned. It moves decisions in the right direction, because it prices the retention effort against the value at stake rather than against a headcount.
The same logic applies to the intervention side. Some accounts are cheap to save and worth saving; some are expensive to save and worth saving; some are expensive and not worth it. Segments that mix these will always produce a debate about whether the retention programme is working, because the answer genuinely differs by segment.
The acquisition side of the same arithmetic
Retention and acquisition are usually discussed separately, and they are the same ratio. Paying more to acquire a customer is justified only if the additional lifetime value exceeds the additional cost — and if the additional customer is retained no better than the average, the arithmetic works differently than expected.
Product-led teams make this concrete by organising around activation and engagement loops instead of campaigns, because the loop is what determines whether an acquired customer stays. The commercial implication is that the product team and the acquisition team are measuring the same thing under two names, and a retention problem is frequently an activation problem in disguise.
What to do on Monday
- Split the churn log into involuntary and voluntary. Ask the customer, or infer it from the proximate cause. The split is usually available and almost never used.
- Build one cohort curve, not an aggregate rate. Pick the cohort from twelve months ago so the curve has had time to mature.
- Compare departing accounts' last-period behaviour with staying accounts'. The gap tells you which of the two churn types dominates.
- Measure gross-margin retention, not customer-count retention. It changes which interventions look worth funding.
- Fix involuntary churn first. It is cheaper to fix, faster to show a result, and it establishes the credibility needed for the harder voluntary-churn work.
- Treat the voluntary-churn curve as a product backlog input, not a marketing problem. The accounts that left because the product no longer fit their need are telling you where to build.
For the acquisition arithmetic these curves feed into, see Customer Lifetime Value; for the account-level work, see Customer Success.
A worked example
The following is hypothetical and illustrative. Suppose a subscription business reports 8 percent quarterly churn and assumes a retention email campaign will fix it. Check 1: split the log. Departing accounts are sorted by proximate cause: those whose usage collapsed weeks before cancellation point to value, while those that lapsed on a billing date point to payment. Because the cited event definition makes "usage collapsed" itself a chosen set of events, the log is checked for instrumentation before any cause is claimed. Check 2: build a curve. A survival curve is drawn for the cohort acquired twelve months ago, not from the aggregate rate, revealing whether losses cluster in the first two months or drip across tenure; activation framing is kept in mind, since voluntary churn can be an activation failure. Check 3: price the saves. Gross-margin retention replaces customer-count retention, so an account whose support cost exceeds its contribution is not worth saving, and retention spend carries the risk of over-investment. The outcome is bounded: backup payment methods recover the involuntary half quickly, while the voluntary curve becomes product backlog input and one structurally unprofitable account is allowed to churn.
A counterargument
A reasonable critic would push back that the voluntary/involuntary split is cleaner in prose than in the logs. Last-period behaviour is suggestive: an account that lapsed on a billing date may have been quietly dissatisfied, so a failed payment can be a proximate cause rather than the root one. Google Analytics' event definition shows that 'usage collapsed' is itself built from chosen events, inheriting the instrumentation problem the article flags elsewhere. Wes Bush's activation framing blurs the line further, since voluntary churn is often an activation failure in disguise. The margin-retention fix helps, but Investor.gov's reminder that returns carry risk suggests retention effort can be over-invested.
The split is a useful heuristic, incomplete as a rule where causes overlap.
References & Further Reading
- Google Analytics Help, 2026. About events (Google Analytics 4) — How an event is defined as a measurable interaction or occurrence, and why the event model determines what can be reported at all.
- Wes Bush, 2026. Product-Led Growth — The activation and engagement loop definition that PLG teams actually use.
- U.S. Securities and Exchange Commission (Investor.gov), 2026. Introduction to Investing — Primary regulator guidance on market mechanics and investor protection.