CI/CD Pipelines Metrics that Matter
A green pipeline is not a fast one. Read the four delivery metrics, a worked example, and why local speed can hide systemic delay.
A team can have a passing test suite and still take weeks to ship a small change. The reason is that pipeline health and delivery performance are different properties. The DORA research programme identified a small set of measures that describe how software actually reaches users, which is more useful than counting builds.
Direct answer: Track deployment frequency, lead time for changes, change failure rate, and time to restore service, as the DORA framework does. GitHub Actions documentation covers the pipeline mechanics. The boundary: these are system-level measures, not targets to game — optimising one in isolation can harm the others, which the observability article warns about for metrics that do not reflect outcomes.
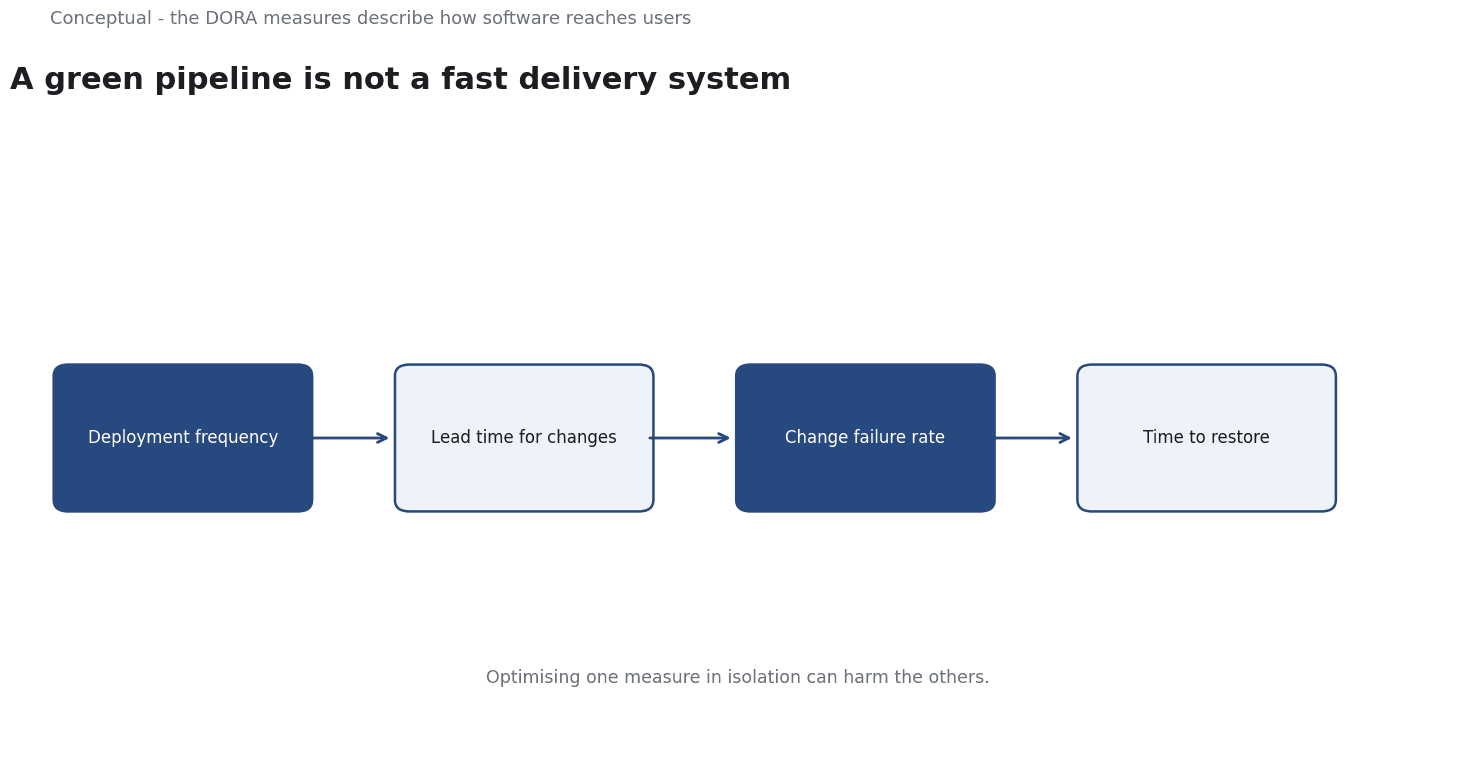
The four measures
Deployment frequency — how often changes reach production. A low frequency usually means large batches, which the DevOps article explains for the risk of infrequent integration.
Lead time for changes — the time from a change being ready to its deployment. A long lead time hides queueing, which the batching-economics article treats as a cost of waiting that no amount of local speed removes.
Change failure rate — the share of deployments that cause a problem requiring a fix or rollback. A low rate with a very low frequency may mean the team rarely ships, which the risk article treats as exposure rather than safety.
Time to restore — how long it takes to recover from a failure. A fast restore can be more valuable than a low failure rate, as Site Reliability Engineering: SLOs, Error Budgets, and Incident Response argues for containment and recovery.
Three consequences follow. The measures should be read together, which the evaluation-rubric article argues for multi-dimensional scoring. They should be measured from the system, not self-reported, as the observability article recommends for reliable signals. And they describe the whole path to production, not one stage, which the data-pipeline article treats as the integration work behind a result.
A worked example
The following is hypothetical and illustrative.
DORA-style measurement shows a lead time of fourteen days from commit to production.
Three checks explain the gap. First, where does the time sit, which the batching-economics article treats as queueing versus processing? The eight-minute pipeline may wait three days for a review and ten for a release window. Second, what is the batch size, as the DevOps article asks for integration frequency? A two-week batch makes each deployment riskier, which the change-failure measure would show. Third, can the team restore quickly, as Site Reliability Engineering: SLOs, Error Budgets, and Incident Response requires? A fast pipeline does not help if rollback takes hours.
Three conclusions follow.
The local metric was real and irrelevant to the outcome, as the evaluation-rubric article warns about proxy measures.
The four-system view reveals the constraint, which the observability article treats as the point of measurement. And the decision to change the release process should be recorded, as the decision-memo article requires.
What pipeline metrics cannot do
They cannot tell you whether you are building the right product, which the value-proposition article treats as the prior question. They do not guarantee reliability, which the site-reliability article frames as a separate discipline of SLOs and error budgets. And they can be gamed by redefining what counts as a deployment, which the data-governance article treats as a definition problem.
The counterargument that these metrics are too abstract for a small team is fair about tooling and wrong about the logic.
A four-number view of delivery is easier to reason about than a dashboard of build times, which the observability article argues for useful alerts over raw data.
A decision test
- Measure the four DORA metrics from the system, not by report.
- Break lead time into queueing and processing, as the batching article advises.
- Check batch size and integration frequency, as the DevOps article recommends.
- Read frequency and failure rate together, as the evaluation-rubric article requires.
- Measure time to restore with the incident-response method.
- Treat the measures as a system, not independent targets, as the observability article warns.
- Review after a change to the pipeline or team, as the monitoring article advises.
For the engineering context, see DevOps; for failure response, see Site Reliability Engineering.
References & Further Reading
- DORA, 2026. DORA | Get Better at Getting Better — The DORA research programme on software delivery performance and the metrics that predict it.
- GitHub, 2026. GitHub Actions Documentation — The CI platform's own documentation, including required status checks.