Customer Journey Mapping: A Template
A journey map is a hypothesis about what a customer experiences. Read the six columns, a worked example, and how to test it with evidence.
Journey maps often fail because they are built in a workshop from assumptions. The resulting poster describes the team's imagination of the customer, not the customer's experience. A useful map is a hypothesis with evidence attached, and every claim on it should be traceable to something a customer actually did or said.
Direct answer: A journey map should record stages, customer actions, questions, emotions, evidence, and the business response — with the evidence column distinguishing observed behaviour from interpretation. Demand-generation material explains the decision stages, and AAPOR's standards apply when the evidence comes from interviews or surveys. The boundary: a map is a simplification of a nonlinear process, not a literal path every customer follows.
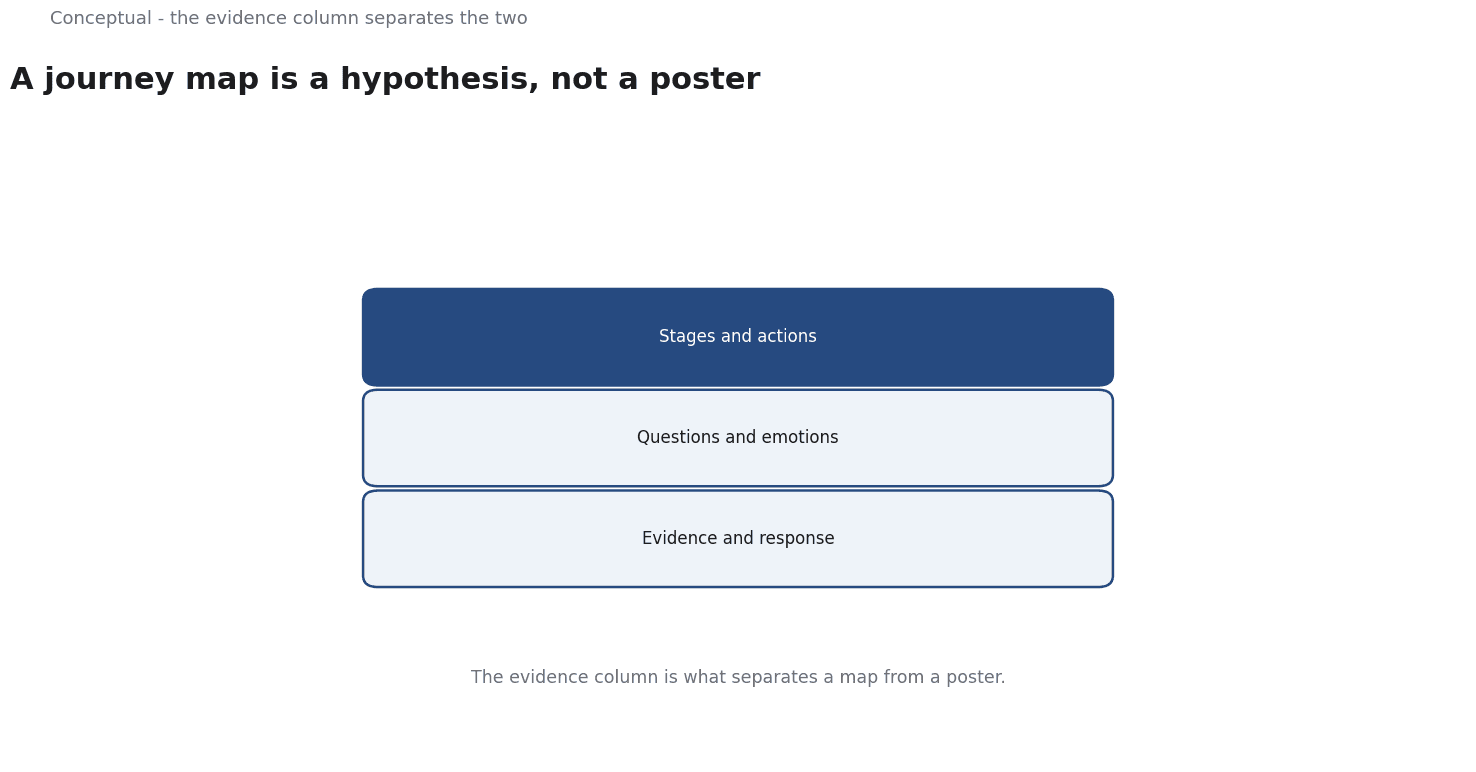
Six columns
Stage — the coarse phase: awareness, consideration, purchase, onboarding, use, renewal.
Customer action — what the person actually does, in observable terms. "Visits the pricing page" is observable; "evaluates options" is an interpretation.
Question — what they are trying to answer at that moment. This is usually inferred, so label it as such.
Emotion — a hypothesis about how they feel. Useful for designing support, dangerous when treated as measured fact.
Evidence — the source for the row: interview quote, support ticket, log data, survey result. This is the column that makes the map honest.
Business response — what the company currently does, and where the gap is.
The evidence column is what separates a map from a poster.
If a row has no evidence, mark it as an assumption.
A worked example of one stage
The following is hypothetical and illustrative.
A SaaS company maps the consideration stage:
| Column | Entry |
|---|---|
| Stage | Consideration |
| Action | Visits pricing page, then leaves; returns two days later |
| Question | "What will this cost once we include seats and support?" |
| Emotion | Uncertain about hidden costs (hypothesis) |
| Evidence | 40 interview notes; 3,000 pricing-page sessions with a 60% exit rate |
| Response | Pricing page lists per-seat cost but not support tiers; no calculator |
Three decisions follow:
- The evidence supports the action, not the emotion. The exit rate is measured; the feeling of uncertainty is a hypothesis. The map should label it.
- The gap is specific. Support tiers are missing from the page, which matches the inferred question. Adding them is a bounded change with a testable result.
- The metric for the change is defined before it is made. Return visits to the pricing page and demo requests from that page, measured against the prior month.
Three cautions apply: interview notes may overrepresent customers who agreed to be interviewed; session data does not reveal motive; and the proposed fix should be tested against the stated metric, not judged by a new map.
Building the map without inventing evidence
Start from behaviour. Log data, support tickets, and sales notes describe what people did. Build the observable rows first.
Add questions from direct contact. Interviews and support conversations reveal what people were trying to decide. Record quotes with permission and mark the sample size.
Label inferences. Anything about emotion or motivation should be tagged as a hypothesis until it is tested. AAPOR's standards on question wording matter here: a leading interview question produces a leading "evidence" entry.
Review the map with customers where possible. Showing a draft to five customers and asking where it is wrong is a cheap correction.
What a journey map cannot do
It cannot predict individual behaviour. A map describes a common pattern, not what any one person will do.
It goes stale. Products, pricing, and competitors change. Tie a review to material changes, not to an annual workshop.
It does not fix the gaps it identifies. The map is a diagnostic. The work is in the response column, with owners and metrics.
The counterargument — that a map is just a diagram — is fair when it contains only opinions.
With evidence and a response column, it becomes a prioritisation tool: the rows with the strongest evidence and the largest gaps are the ones to fix first.
A decision test
- Build observable rows first from logs and records.
- Add questions from interviews with sample sizes stated.
- Label emotions and motives as hypotheses.
- Fill the evidence column or mark the row as an assumption.
- Write the current business response and the gap.
- Prioritise by evidence strength and gap size.
- Review on change and test each fix against a defined metric.
For the stage framework, see Demand Generation vs Lead Generation; for the research standards, see AAPOR.
References & Further Reading
- Wikipedia contributors, 2026. Demand generation - Wikipedia — An overview of demand generation as a marketing discipline distinct from lead generation; secondary reference used with the lead-generation entry.
- American Association for Public Opinion Research, 2026. AAPOR — The professional association for public opinion and survey research; its standards and resources underpin the survey-design discussion.